GTA Industrial Absorption Trends: 10-Year Overview
GTA Industrial Absorption Trends: 10-Year Overview
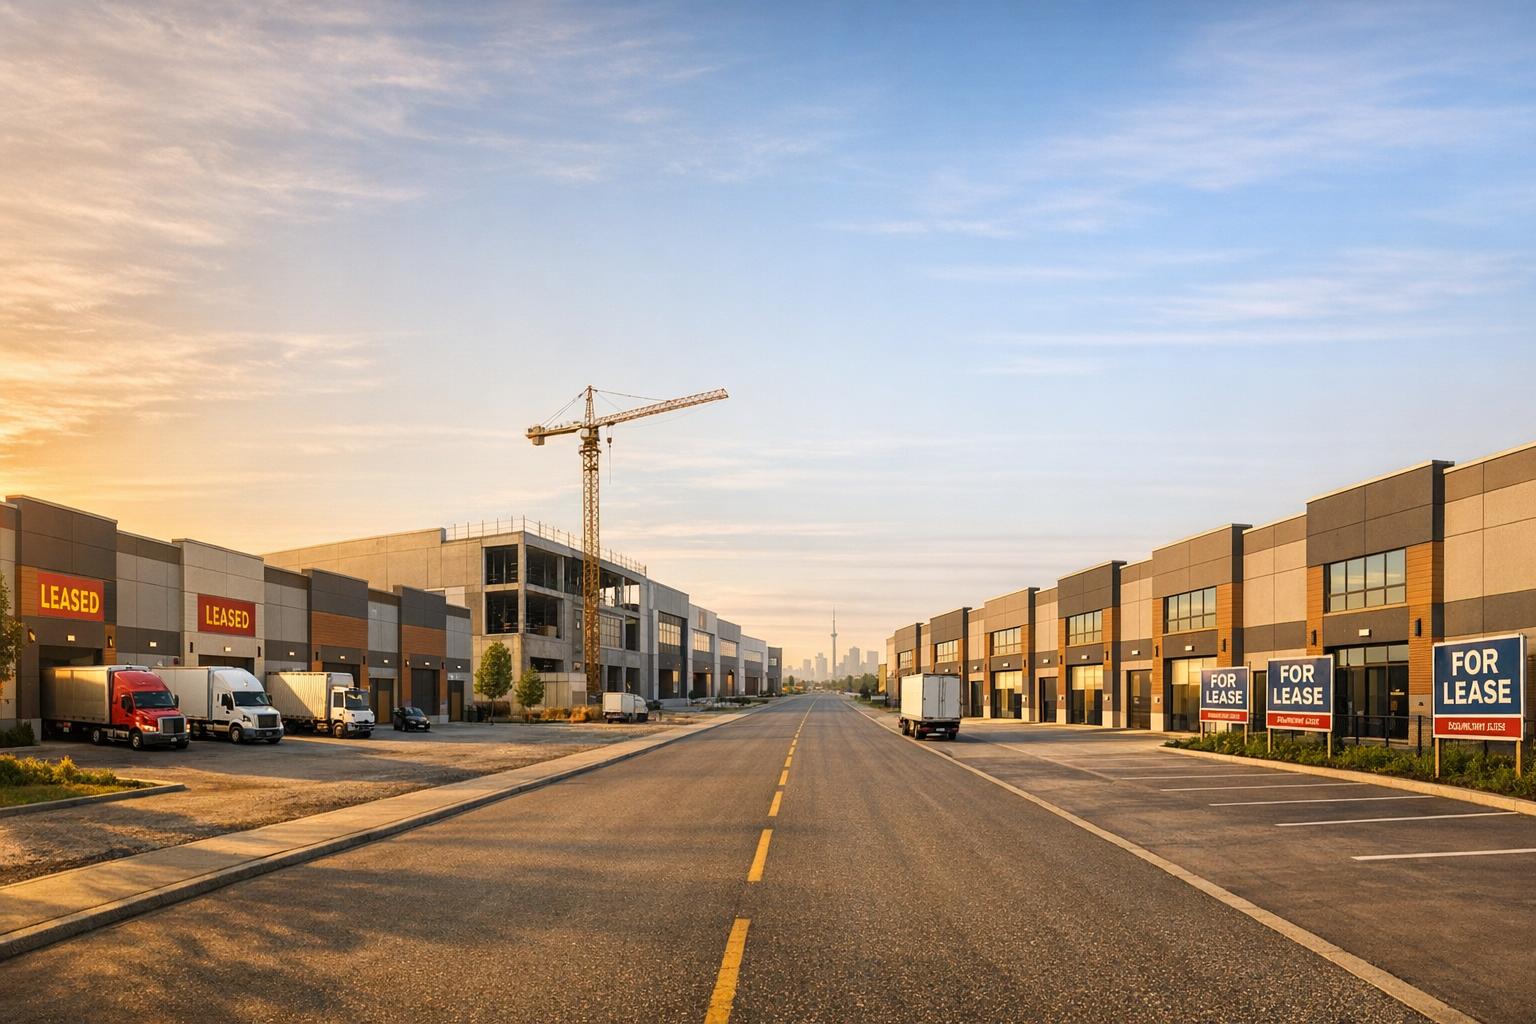
The Greater Toronto Area (GTA) industrial real estate market has experienced major changes over the past decade. Here’s a quick summary:
- Market Size: The GTA has 834 million sq. ft. of industrial inventory, making it one of the largest markets in North America.
- Demand Shifts:
- From 2016 to 2021, strong demand pushed availability to a record low of 0.9% and increased rental rates by 75%.
- From 2021 to 2024, 60 million sq. ft. of new supply entered, but absorption slowed.
- By 2025-2026, vacancy rates rose to 4.5%, the highest in nine years, as demand hit an 11-year low.
- Current Conditions:
- Availability climbed to 5.1% by Q1 2026.
- Average asking rents dropped by 6.6% year-over-year to $16.56 per sq. ft. by Q4 2025.
- Tenants now have more negotiating power, while landlords are offering concessions.
- Investor Focus: High-quality assets in logistics and modern facilities remain priorities. Older properties risk losing value if they don’t meet automation or ESG standards.
The GTA industrial market is stabilizing in 2026, with positive absorption trends and reduced construction pipelines offering cautious optimism for the future.
The Most Underrated Shift in GTA Industrial Real Estate (You Need to Know This)

sbb-itb-1862e65
1. GTA Industrial Market Absorption Trends (2016–2026)
GTA Industrial Market: 10-Year Absorption Trends (2016–2026)
Absorption Trends
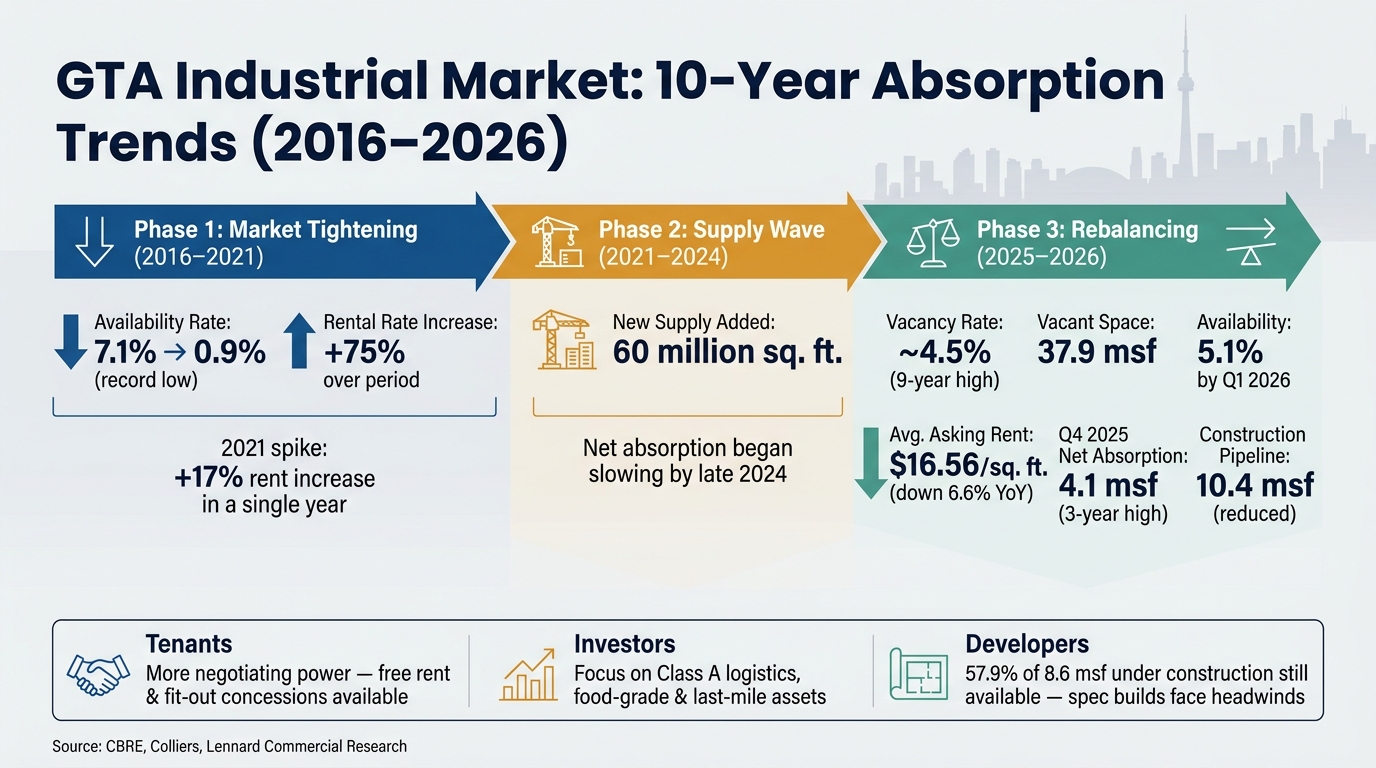
The GTA industrial market has seen three distinct phases over the past decade. From 2016 to 2021, the market tightened significantly. Availability rates dropped from 7.1% - a peak last seen in 2010 - to a record low of just 0.9% by the end of 2021. During this period, asking net rents soared by 75%, with a notable 17% spike in 2021 alone.
The second phase, spanning 2021 to 2024, saw a wave of new developments adding 60 million square feet (msf) of industrial space to the market. However, by late 2024, net absorption began to slow considerably. The final phase, from 2025 to 2026, brought a major shift. By the fourth quarter of 2024, 37.9 msf of space remained vacant, pushing the vacancy rate to about 4.5% - the highest in nine years.
| Phase | Period | Key Metrics |
|---|---|---|
| Tightening | 2016–2021 | Availability fell from 7.1% to 0.9%; rents increased by 75% |
| Transition | 2021–2024 | 60 msf of new supply entered the market; net absorption slowed |
| Supply Surge | 2025–2026 | Vacancy rose to ~4.5%, with 37.9 msf vacant; demand hit an 11-year low |
These phases highlight the evolving dynamics of the GTA industrial market.
Market Insights
A combination of rising interest rates and inflation has slowed business expansion, coinciding with the arrival of record-breaking new construction volumes. The GTA East submarket reflects these regional trends, with its vacancy rate reaching a decade-high by late 2024 due to an influx of new supply.
One example of market adaptation during the earlier tightening phase comes from Carttera. The company acquired the former Roche Canada headquarters in Mississauga and converted it into a 248,000-square-foot modern industrial facility. This project capitalized on the scarcity of high-quality industrial space and the underuse of older suburban office buildings.
Impact on Decision-Making
These shifting conditions have reshaped strategies for tenants, landlords, and investors. Tenants, particularly in high-vacancy areas like GTA East, now have more negotiating power, enabling them to secure rental concessions and flexible lease terms. Landlords, on the other hand, are responding with aggressive leasing strategies to fill vacant spaces in a more competitive landscape. For investors, the focus has shifted to prioritizing asset quality and location, even as the GTA continues to hold strong long-term potential. As of 2025, the region ranked second among major North American industrial hubs.
2. Lennard Commercial - Industrial Real Estate Services

Absorption Trends
The Greater Toronto Area (GTA) industrial market has undergone major changes over the last ten years, creating challenges and opportunities for tenants, landlords, and investors. Lennard Commercial, under the leadership of Michael Law, uses proprietary data to track these market shifts and predict future trends. This forward-looking approach helps clients not only understand the current market but also anticipate what’s next. Lennard Commercial leverages these insights to fine-tune strategies and provide clients with a deeper understanding of the market.
Market Insights
What sets Lennard Commercial apart is its focus on submarket-level analysis. Instead of relying solely on GTA-wide statistics, the firm digs into specific areas. For instance, identifying GTA East as a region with higher vacancy rates allows them to offer tailored advice to clients. This granular data helps clients understand local pricing trends and negotiate terms that align with the unique dynamics of each submarket. By moving past broad market narratives, Lennard Commercial ensures its clients' decisions are based on precise, actionable insights.
Specialized Services
Lennard Commercial provides support through every stage of a real estate transaction. Whether it's renegotiating a lease in a soft market, securing space for logistics operations, or assessing an industrial property for purchase, their advisory services are built on up-to-date data. For example, the firm's analysis of late-2025 recovery signals - including 4.1 million square feet of positive absorption, the highest in three years - enables clients to act confidently during critical market phases. This timely intelligence ensures clients are well-prepared to seize opportunities as they arise.
Impact on Decision-Making
In today’s market, where supply often outpaces demand, Lennard Commercial’s data-driven approach provides clarity amidst uncertainty. By examining factors like zoning regulations, local labour availability, and submarket vacancy rates, the firm uncovers opportunities that might go unnoticed in broader analyses. This method encourages clients to adopt a strategic, informed perspective, aligning their decisions with the absorption trends that have shaped the GTA industrial market over the past decade.
Pros and Cons
The GTA industrial market presents both opportunities and challenges, especially as conditions evolve post-2024. Tenants, landlords, and investors must weigh these carefully to navigate the shifting landscape.
| Factor | Pros | Cons |
|---|---|---|
| Market Scale | The market boasts a massive inventory, offering diverse opportunities. | However, broad market data can obscure key differences between submarkets. |
| Tenant Leverage | Rising vacancy rates, which hit a nine-year high of about 4.5%, are giving tenants more room to negotiate. | In competitive submarkets like GTA North, additional concessions remain harder to secure. |
| Rental Rates | Rental rates fell approximately 6.6% year-over-year to $16.56 per sq. ft. by Q4 2025, though they are still 65% higher than five years ago. | Asking rents remain above levels that would make new industrial construction financially feasible. |
| Supply Pipeline | The construction pipeline shrank significantly, down to 9.1M sq. ft. across 18 buildings, which could reduce oversupply pressures. | However, about 70.3% of the new supply delivered in late 2025 remained unleased. |
| Asset Quality | High demand for modern Class A spaces supports long-term value. | Older Class B and C properties risk a "brown discount" of over 15% if they fail to meet ESG or automation standards. |
| Submarket Divergence | Premium rents in submarkets like GTA North highlight areas of strong performance. | Meanwhile, areas like GTA East saw a 10-year high in vacancy in 2025, reflecting an uneven recovery. |
These trends underscore how market shifts are reshaping deal-making strategies for both tenants and investors.
For tenants, leases expiring between 2026 and 2029 could benefit from the current high vacancy rates, leading to perks like free rent periods and fit-out allowances.
Adrian Lee, Managing Director at CBRE Toronto West, explained:
"Deals are getting more expensive and complicated to do and it's taking longer to get them done but demand is still there and it's quite healthy."
Investor activity also saw a slight dip, with transaction volumes reaching $5.3 billion in 2025 - a 4% decline from the previous year. Capital is increasingly directed toward defensive assets such as logistics facilities, food-grade spaces, and last-mile urban properties. However, properties that fail to meet automation and ESG standards risk losing their competitive edge.
Lennard Commercial's detailed analysis sheds light on opportunities and risks, from capturing value in softer markets like GTA East to securing prime positions in GTA North before the construction pipeline tightens further.
Conclusion
The GTA industrial market has seen major shifts over the last decade. Availability dropped significantly from 7.1% in Q1 2010 to a historic low of 0.9% in Q4 2021. By Q4 2025, it had normalized to 4.8%, reflecting a more balanced market.
Signs of stabilization are becoming clearer. Net absorption hit a three-year high of 4.1 million sq. ft. in Q4 2025, while the construction pipeline eased to 10.4 million sq. ft. under construction in early 2026. As Drew Rider of Colliers pointed out:
"The significant uptick in absorption signals growing tenant confidence. The market is stabilizing, and 2026 is shaping up with cautious optimism."
These trends highlight opportunities for stakeholders to adjust their strategies.
- Occupiers: With leases expiring, tenants now hold more negotiating power. Average asking net rents have dropped to $16.54 per sq. ft., down 6% year-over-year, and landlords are showing greater flexibility, including offering concessions.
- Investors: Defensive assets like logistics hubs and food-grade facilities are worth prioritizing. The Bank of Canada's 2.25% rate pause has also narrowed the bid-ask spread, creating a more favourable investment environment.
- Developers: High-spec, design-build projects are the safer bet right now, as speculative builds face challenges. Currently, 57.9% of the 8.6 million sq. ft. under construction remains available.
The evolving absorption patterns of the past decade offer valuable lessons for navigating today’s market. Leveraging these insights, Lennard Commercial's industrial real estate services provide occupiers, investors, and developers with the tools and market data needed to secure better lease terms, reposition properties, or identify new opportunities in this dynamic landscape.
FAQs
What’s the difference between absorption, availability, and vacancy?
When it comes to industrial real estate, absorption, availability, and vacancy are terms that often come up. While they may sound similar, each one has its own specific meaning:
- Absorption: This refers to the net amount of space that has been leased or vacated over a certain period. It’s a key indicator of market demand. For example, if more space is leased than vacated, it results in positive absorption.
- Availability: This includes all the space currently being offered on the market. It’s a broader measure that accounts for both vacant spaces and those available for sublease.
- Vacancy: This represents the percentage of space that is physically unoccupied and ready for immediate use. Unlike availability, vacancy excludes spaces offered through subleasing.
Understanding these terms helps paint a clear picture of the industrial real estate landscape.
Will GTA industrial rents keep falling in 2026?
Industrial rents in the Greater Toronto Area (GTA) are anticipated to stabilize or even dip slightly by 2026. This shift is largely due to rising availability and an increase in supply. Recent figures show that asking net rental rates have decreased by about 6–6.6% compared to the same period last year, as of early 2026. These changes highlight a shift towards a more balanced industrial real estate market in the region.
Which GTA submarkets offer the best negotiating leverage right now?
Submarkets with more available sublease space are where tenants currently have the most room to negotiate. This is largely because many businesses are looking to shed extra space they no longer need. On the other hand, regions with high demand - particularly those tied to logistics and distribution - stand out as promising areas, even with a growing supply.
Written by
Michael Law
Partner, Lennard Commercial · Industrial Real Estate Specialist