
Industrial Cap Rates in Toronto: Q&A with Market Experts
Industrial Cap Rates in Toronto: Q&A with Market Experts
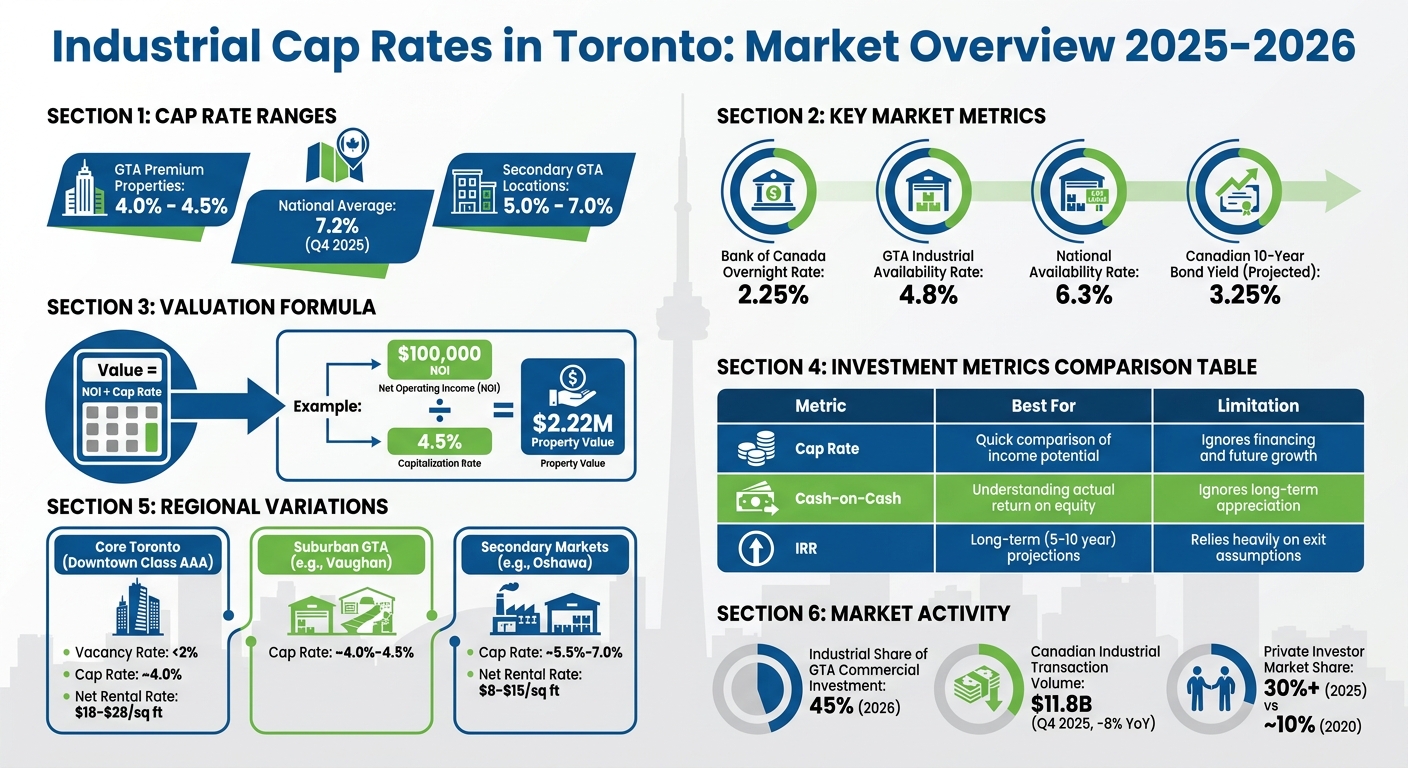
The Greater Toronto Area (GTA) industrial real estate market is highly competitive, with cap rates - a key metric for evaluating property investments - falling between 4.0% and 4.5% for premium properties. These rates are lower than the national average of 7.2% (as of Q4 2025), reflecting strong demand, limited supply, and low perceived risk. Key drivers include:
- Interest Rates: Rising rates typically push cap rates higher, but the Bank of Canada’s current overnight rate of 2.25% provides stability.
- Supply & Demand: GTA's industrial availability rate is 4.8%, below the national level of 6.3%, thanks to resilient demand and constrained land supply.
- Investor Confidence: High-quality Class A properties with features like 30+ ft clear heights attract lower cap rates. Meanwhile, secondary locations and older properties offer higher cap rates but come with more risk.
Cap rates help investors estimate property values using the formula:
Value = NOI ÷ Cap Rate.
For example, a property with $100,000 NOI and a 4.5% cap rate is valued at $2.22M. However, factors like tenant quality, location, and infrastructure access can impact cap rates significantly.
Toronto's industrial market benefits from its proximity to major transportation hubs and a growing focus on logistics. Long-term trends, such as e-commerce growth and supply chain adjustments, suggest continued demand for modern, well-located facilities. Investors should prioritize properties with stable cash flow, reliable tenants, and features like automation infrastructure to navigate this evolving landscape.
Toronto Industrial Real Estate Cap Rates: Key Metrics and Investment Comparison 2025-2026
Toronto-East Industrial Market: Strong Fundamentals Amid Rising Vacancies
sbb-itb-1862e65
Factors That Affect Industrial Cap Rates in Toronto
Cap rates reflect the broader economic landscape, market dynamics, and investor confidence. Grasping these elements is crucial for making informed decisions in Toronto's industrial real estate sector.
Economic Trends and Interest Rates
The Bank of Canada's policy rate and the Canadian 10-year bond yield are key influences on cap rates. When interest rates rise, borrowing costs increase, and investors demand higher returns, which pushes cap rates upward. Conversely, lower rates tend to compress cap rates. At present, the market is contending with a prolonged period of elevated interest rates. Projections suggest the Canadian 10-year bond yield will settle at around 3.25% in the long term. Cushman & Wakefield commented on this environment:
"The path forward is shaped by higher-for-longer interest rates and marginally neutral-to-positive leverage conditions, suggesting a gradual improvement rather than a rapid rebound ahead."
Beyond interest rates, supply and demand dynamics play a crucial role in shaping market outcomes.
Supply, Demand, and Market Fundamentals
The interplay between available space and tenant demand has a direct impact on rental income and property values, which in turn affect cap rates. In 2025, Canada’s industrial market saw a notable shift. The first half of the year recorded a negative net absorption of 1.1 million square feet, but the second half rebounded significantly, with a net absorption of 7.9 million square feet.
On a national scale, the industrial availability rate reached 6.3% in Q4 2025, marking a 20 basis point year-over-year increase. This was primarily driven by a surge in new supply completions alongside a slowdown in leasing activity. Altus Group highlighted this trend:
"The primary driver for this expansion [in industrial cap rates] was a notable softening in demand fundamentals."
Despite these national figures, the GTA demonstrated resilience. By late 2025, the availability rate in the region had dropped to 4.8%, even with nearly 5 million square feet of new supply entering the market. These conditions provide a backdrop for understanding how investor sentiment shapes cap rates.
Investor Sentiment and Risk Appetite
Investor confidence plays a pivotal role in cap rate trends. When confidence is high, investors are more willing to accept lower cap rates. Conversely, during periods of uncertainty, they demand higher returns to offset perceived risks. Currently, a "flight-to-quality" trend is evident, with investors favouring modern Class A facilities over secondary properties. These premium assets attract lower cap rates due to their stability and reduced risk profile.
Victor Cotic, Executive Vice President of Colliers Toronto Brokerage, noted:
"Real estate investors are generally bullish long-term on the GTA's industrial investment market and want to add to their portfolio."
However, trade uncertainties, such as the CUSMA review and potential U.S. tariffs, have led to a cautious approach among some investors. This hesitancy contributed to an 8% year-over-year decline in Canadian industrial transaction volumes, which totalled $11.8 billion by Q4 2025. Despite this, private investors have significantly increased their presence in the GTA market, growing from around 10% in 2020 to over 30% by 2025. International investors remain optimistic as well, with Jon Ramscar, President and CEO of CBRE Canada, affirming:
"We're coming off a year of uncertainty, but international capital has already voted in favour of Canadian commercial real estate."
GTA Industrial Cap Rates by Region
Regional factors play a key role in shaping cap rate trends across the GTA, adding another layer to the broader market fundamentals. Location is a major driver of these variations, with the gap between core Toronto assets and suburban properties widening significantly. This divide is influenced by factors like vacancy rates, tenant preferences, and infrastructure development.
Core vs. Suburban Markets
Industrial properties in downtown Toronto operate under entirely different conditions compared to those in suburban areas. By the end of 2025, vacancy rates for downtown Class AAA assets were below 2%, whereas the national average sat at 6.3%. This scarcity has kept cap rates for core properties relatively tight, even as market-wide conditions have nudged rates higher elsewhere.
Investors are increasingly drawn to high-quality, centrally located logistical hubs. As Altus Group noted, there’s a clear preference for "premium, well-located logistical hubs" over secondary assets. Modern facilities in prime locations tend to have lower cap rates due to their perceived stability and reliability. On the other hand, older Class B or C properties in suburban areas often come with higher cap rates, reflecting the risks tied to obsolescence. Infrastructure projects like the Eglinton Crosstown and GO Expansion have further heightened interest in transit-accessible properties across the GTA.
While the differences between core and suburban markets are pronounced, emerging submarkets bring their own unique opportunities and challenges.
Emerging Submarkets
Small-bay industrial properties have shown strong resilience amid broader market shifts. Unlike large-bay speculative developments, which often face difficulties attracting tenants, small-bay facilities catering to local businesses have demonstrated more stable fundamentals and better resistance to economic fluctuations. This creates attractive opportunities for investors interested in smaller-format assets in up-and-coming areas.
However, speculative supply levels vary widely across the GTA. By the end of 2025, 70.3% of newly delivered industrial space was still available. This broad figure, though, hides significant regional differences. Certain submarkets, particularly those tied to heavy manufacturing in Toronto East’s steel and automotive industries, experience greater volatility due to ongoing trade tensions with the United States. In contrast, well-located submarkets are quickly absorbing new space, establishing conditions for cap rate stability or even compression in select areas.
Using Cap Rates for Investment Decisions
Cap rates are a practical way to make informed decisions when buying, selling, or repositioning industrial properties in the GTA. With the market conditions discussed earlier, cap rate analysis becomes a key part of crafting effective investment strategies.
Cap Rates as a Valuation Tool
The formula - Value = NOI ÷ Cap Rate - is at the heart of property valuation. But its effectiveness depends on accurate inputs, especially the Net Operating Income (NOI). Sellers often present overly optimistic figures, omitting management fees, underestimating maintenance costs, or using outdated tax data. As an investor, it’s essential to scrutinize these assumptions rather than taking them at face value.
Cap rates also allow for comparisons across different submarkets. For example, a property in Vaughan near Highway 401/400 might trade at a cap rate of around 4.0%, while a similar property in Oshawa could be priced closer to 5.5%. This difference reflects factors like tenant quality, infrastructure access, and long-term demand. When weighing opportunities, comparing properties within their specific submarkets is much more insightful than treating all GTA assets as equal.
For long-term investments, terminal cap rates help project future exit values. For instance, if you purchase a property today at a 4.5% cap rate, but market conditions push rates to 5.0% over the next five years, your exit value will decrease. On the other hand, if rates compress to 4.0%, the value would rise significantly.
Strategies for Maximizing Returns
Cap rates are just one piece of the puzzle. Investors can apply additional strategies to enhance returns. A key focus should be on rent growth rather than solely the purchase price. As Seven Appraisal Inc. observed:
"An industrial building in Brampton or Vaughan could easily appraise for significantly more today than just a few years ago - based purely on rent growth and occupancy improvements, without any physical changes to the property".
Securing long-term leases with creditworthy tenants and annual rent escalations is another way to boost NOI and property value.
When evaluating investments, it’s smart to combine multiple metrics rather than relying exclusively on cap rates. For example:
- Cash-on-Cash Return provides insight into the actual yield after accounting for debt costs.
- Internal Rate of Return (IRR) evaluates total returns over time, factoring in the time value of money over a 5–10 year horizon.
Here’s a quick comparison of these metrics:
| Metric | Best For | Limitation |
|---|---|---|
| Cap Rate | Quick comparison of income potential | Ignores financing and future growth |
| Cash-on-Cash | Understanding actual return on equity | Ignores long-term appreciation |
| IRR | Long-term (5–10 year) projections | Relies heavily on exit assumptions |
Timing is also crucial, especially in a fluctuating interest rate environment. Industrial real estate accounted for 45% of all commercial investment activity in the GTA as of 2026, making competition for top-tier assets intense. If the Bank of Canada raises interest rates later in 2026, cap rates could expand, creating opportunities to buy as prices soften. On the flip side, if you own a property with strong fundamentals and secured tenants, cap rate compression could signal the perfect time to sell and maximize value.
For those priced out of core markets, secondary locations present compelling opportunities. Older warehouses in places like Oshawa offer higher initial cap rates (5.0%–7.0%) and the chance to increase value through upgrades, such as improving clear heights or enhancing loading configurations.
What's Next for Industrial Cap Rates in Toronto
The Greater Toronto Area (GTA) industrial market is entering a phase where strategic decision-making is more important than ever. The future of cap rates will hinge on factors like trade policies, monetary trends, and the balance between supply and demand.
Short-Term Projections
In the near term, cap rates are being shaped by three key factors: steady interest rates, trade uncertainty, and a slowdown in new construction. As of early 2026, the Bank of Canada has paused its rate adjustments, maintaining the overnight rate at 2.25%. This stability provides investors with a more predictable borrowing environment, which is crucial when assessing cap rate movements.
However, trade tensions with the United States are creating challenges, particularly for manufacturing-heavy areas like Toronto East. As Marcus & Millichap observed:
"Trade relations with the U.S. will remain a key factor closely watched by tenants and investors. Greater clarity on trade policy or a resolution to the current dispute would likely encourage many businesses to reengage expansion and investment plans".
Until these trade issues are resolved, investors are seeking higher risk premiums, which is pushing cap rates up - especially for assets tied to cross-border manufacturing and logistics.
Adding to the complexity, net absorption has been lagging behind new completions, leading to rising vacancy rates across the GTA. This dynamic is contributing to upward pressure on cap rates in certain areas. However, the small-bay industrial segment has proven more resilient, largely insulated from trade-related volatility. Victor Cotic, Executive Vice President at Colliers, highlighted the importance of cash flow in navigating this environment:
"Opportunities with cashflow provide a safeguard for any near term rental rate softening and position investors well for the eventual uptick in rents expected as new construction slows to a standstill by late 2026".
In the short term, cap rates are likely to stabilize or see a slight increase. Investors focusing on quality assets with reliable tenants are positioned to make the most of these conditions. While short-term pressures may push cap rates up, the emphasis on quality and infrastructure is expected to drive long-term value.
Long-Term Trends
The long-term outlook for GTA industrial real estate remains promising. Several factors, including the rise of e-commerce, shifts in supply chain strategies, and nearshoring, are driving sustained demand for warehouse and distribution spaces. Many companies are moving away from "just-in-time" inventory systems to "safety stock" models, which require additional space to manage supply chain disruptions.
Infrastructure is another critical factor. Toronto's extensive network of highways - such as the 401, 400, 407, and the Gardiner Expressway - along with its proximity to Pearson International Airport, rail lines, and port facilities, gives the region a lasting advantage for logistics. This connectivity supports long-term property value growth, particularly in areas with strong highway access.
By late 2026, new construction is expected to slow significantly, which should lead to higher rents and help stabilize or even lower cap rates. Limited land availability in Toronto's core will continue to restrict new supply, keeping property values strong in urban locations. Sustainability features, like EV charging stations, solar panels, and LEED certifications, are becoming increasingly important for property valuations, especially among institutional investors.
Over the long term, the market is expected to shift toward higher-quality assets. Modern Class A facilities with features like 32+ foot clear heights and automation infrastructure are likely to see lower cap rates, while older Class B and C properties may face challenges due to functional obsolescence, leading to higher cap rates. Investors focusing on well-located, high-quality properties with strong environmental, social, and governance (ESG) credentials will likely benefit as the market evolves further.
Conclusion
The insights shared in this article highlight that investing in Toronto's industrial real estate involves much more than simply examining cap rates, which typically fall between 4.0% and 5.5% in primary markets. As Jonathan Squires wisely points out:
"A cap rate derived from faulty income or expenses is not an accurate measure".
To make informed decisions, it's crucial to verify net operating income (NOI) and use other metrics like internal rate of return (IRR) and cash-on-cash return. These tools provide a fuller picture of a property's financial performance.
Location and property classification are equally important. Urban areas in Toronto command higher net rental rates - ranging from $18 to $28 per square foot - compared to $8 to $15 in more remote locations. Modern Class A facilities, offering features like 30+ ft clear heights and advanced logistics capabilities, consistently outperform older Class C properties.
Toronto's industrial market benefits from structural advantages like limited land availability, proximity to half of Canada's population, and access to world-class transportation networks. These factors support long-term growth potential. However, near-term challenges make it essential to carefully evaluate tenants and lease terms to maintain stable cap rates.
Investors should focus on quality over quantity. Properties with modern features such as advanced electrical capacity for automation or EV charging and elements aligned with ESG goals are increasingly in demand. Trends like nearshoring, e-commerce growth, and supply chain resilience present opportunities for those who adopt a broader, strategic view of cap rates. By prioritizing modern, high-quality facilities, investors can confidently navigate Toronto's dynamic industrial real estate market.
FAQs
How do I verify a property’s NOI before using a cap rate?
To determine a property’s Net Operating Income (NOI), you need to subtract all operating expenses from the gross rental income. Operating expenses typically include costs like maintenance, property management fees, property taxes, and insurance.
Here’s a quick example:
If the gross rental income is $50,000 and the operating expenses total $15,000, the NOI would be:
$50,000 - $15,000 = $35,000
It's important to ensure that all expenses are accurately accounted for. This step is essential to calculate a dependable NOI, which is a key figure when applying the cap rate formula.
When should I use cap rate vs cash-on-cash or IRR?
The cap rate is a handy tool for gauging the return and risk of an income-generating property. It’s calculated by comparing the property’s net operating income (NOI) to its current market value. This makes it especially useful for comparing different properties or understanding broader market trends. If you're looking for a quick snapshot of how a property stacks up in the market, cap rate does the job well.
On the other hand, the cash-on-cash return zeroes in on your immediate cash flow. It shows how the cash you’ve invested directly relates to the cash you’re earning. Meanwhile, the internal rate of return (IRR) takes a broader view, factoring in not just cash flow but also future appreciation and overall profitability.
While cap rate shines for quick market comparisons, cash-on-cash return and IRR provide deeper insights into cash flow and long-term performance. Each metric serves a different purpose, so knowing when to use them is key.
What property features most affect GTA industrial cap rates?
Industrial cap rates in the Greater Toronto Area (GTA) are shaped by several factors, including location, property type, and market demand. Properties in sought-after areas, such as downtown Toronto, typically feature lower cap rates, often ranging between 3% and 5%. This reflects their stability and reduced risk for investors.
In contrast, properties situated farther from the city core or those with higher vacancy rates tend to have higher cap rates, as they carry greater risk. Additional elements, such as rental rates, vacancy levels, and the growing demand for logistics and warehouse spaces, also significantly impact cap rates in the region.
Written by
Michael Law
Partner, Lennard Commercial · Industrial Real Estate Specialist