
Capitalization rate meaning for GTA industrial investors
By Michael Law · Industrial Real Estate Broker, Lennard Commercial Realty
TL;DR:
- The cap rate measures a property’s unleveraged annual yield by dividing net operating income by market value. Accurate NOI reflecting market rents is essential, as it significantly influences the cap rate and its interpretation of risk and value. In GTA industrial markets, cap rates have expanded since 2022, creating opportunities for investors focused on realistic, well-supported return projections.
The capitalization rate, known in commercial real estate as the cap rate, is defined as a property’s net operating income divided by its current market value, expressed as a percentage. This ratio estimates the unleveraged annual yield an investor can expect from an income-producing property before any financing costs are applied. For industrial real estate investors evaluating assets across Toronto, Mississauga, Brampton, Vaughan, and the broader GTA, understanding capitalization rate meaning is the foundation of every acquisition, disposition, and portfolio review decision. Get this metric wrong and every subsequent calculation is built on a flawed premise.
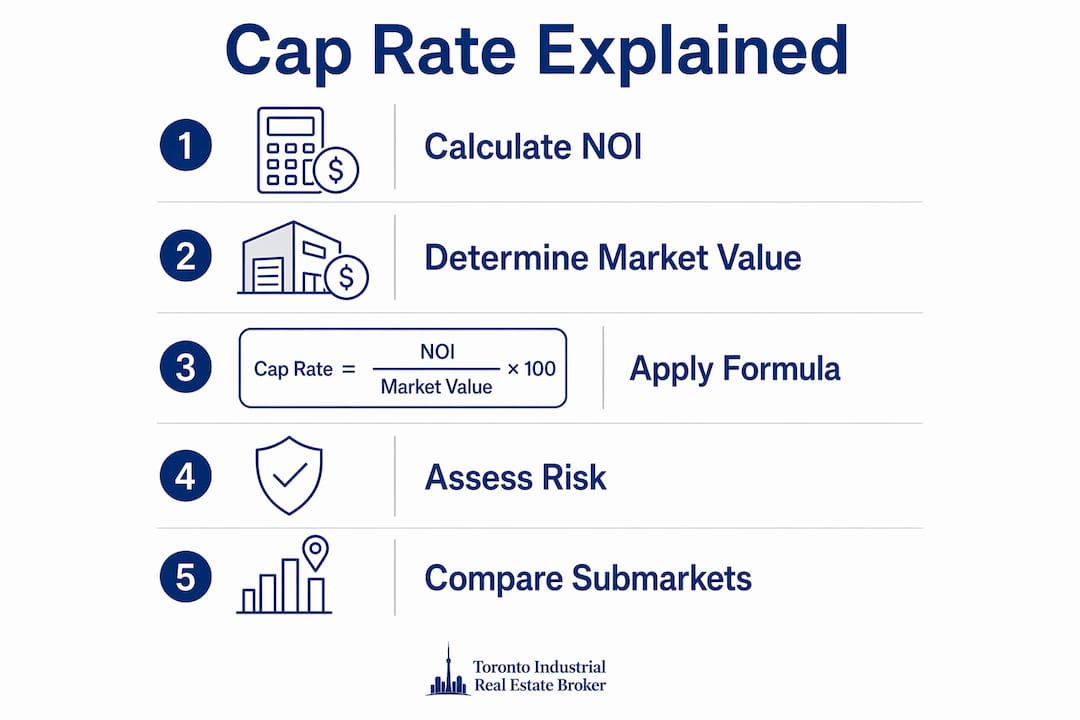
What is the capitalization rate formula and how does NOI factor in?
The cap rate formula is straightforward: Cap Rate = (Net Operating Income / Current Market Value) × 100. Despite its simplicity, the formula’s reliability depends entirely on the accuracy of the net operating income figure you feed into it.

Net operating income is gross rental income minus all operating expenses. Those expenses include property management fees, insurance, maintenance, utilities, and property taxes. What NOI excludes is critical: mortgage payments, capital expenditures, depreciation, and income taxes are all left out of the calculation. This exclusion is intentional. Cap rate is designed to measure the property’s performance independent of how it is financed, so two investors using different mortgage structures will arrive at the same cap rate for the same asset.
Here is a concrete example using typical GTA industrial property figures:
- Identify gross annual rental income: $1,500,000
- Subtract operating expenses (management, insurance, taxes, maintenance): $300,000
- Arrive at NOI: $1,200,000
- Divide NOI by current market value: $1,200,000 / $24,000,000
- Multiply by 100 to express as a percentage: 5.00% cap rate
This result tells you the property generates a 5% annual unleveraged return at its current price. If the asking price rises to $30,000,000 with the same NOI, the cap rate drops to 4.0%. That shift matters enormously when you are comparing two warehouses in Vaughan or two logistics facilities in Mississauga.
A common error investors make is using in-place NOI from a below-market lease rather than stabilised NOI reflecting market rents. Cap rates in commercial real estate are best estimated from comparable stabilised transactions applied to stabilised year-one NOI. Using a distorted NOI produces a distorted cap rate, which then distorts your sense of value.
Pro Tip: Before calculating cap rate on any GTA industrial property, verify that the NOI reflects current market rents, not legacy lease rates that may be 20% to 30% below market. A free tool like the NOI calculator at DealAnalyzerAI can help you structure the calculation correctly before you run the cap rate.
What does cap rate reveal about investment risk and property value?
Cap rate is not just a yield number. It is a compressed signal about perceived risk, market competitiveness, and the relationship between income and price for a given asset. Understanding what the number implies is as important as knowing how to calculate it.
The inverse relationship between cap rate and property price is one of the most misunderstood dynamics in real estate investing. When NOI remains constant, a higher property price produces a lower cap rate, and a lower price produces a higher cap rate. A property generating $1,000,000 in NOI priced at $20,000,000 carries a 5.0% cap rate. Price the same asset at $25,000,000 and the cap rate falls to 4.0%. This means buyers paying premium prices are accepting lower yields, which is only rational if they expect NOI growth or capital appreciation.
Key signals embedded in cap rate figures for GTA industrial properties:
- Higher cap rates (6.5% and above) generally reflect higher perceived risk. This could mean a secondary location, a shorter lease term, a single-tenant concentration risk, or a property requiring significant capital investment. Higher cap rates can also signal a buyer’s market where pricing has softened.
- Lower cap rates (4.5% to 5.5%) indicate stable, lower-risk assets in competitive markets. Prime logistics facilities in Mississauga or Brampton with long-term credit tenants routinely trade at tighter cap rates because institutional buyers accept lower yields for predictable income.
- Cap rate compression occurs when prices rise faster than NOI. The GTA industrial market experienced significant compression between 2019 and 2022 as demand for logistics and warehousing space surged. Investors who bought at compressed cap rates were betting on continued NOI growth to justify the price.
- Cap rate expansion occurs when prices fall or NOI stagnates. Rising interest rates from 2022 onward pushed cap rates higher across the GTA industrial sector, resetting valuations downward.
Cap rate also functions as a risk-adjusted return signal when comparing properties across different submarkets. A 5.5% cap rate on a Vaughan distribution centre and a 6.2% cap rate on an Oshawa manufacturing facility are not directly comparable without understanding the local vacancy rates, tenant quality, and lease structures in each submarket. The number alone does not tell the full story.
How do going-in and exit cap rates differ for industrial property investors?
The distinction between going-in and exit cap rates is one of the most practically important concepts in industrial real estate underwriting, yet it is frequently glossed over in introductory discussions of cap rate definition.
The going-in cap rate uses the first year’s stabilised NOI and the acquisition price. It answers the question: what yield am I buying today? The exit cap rate applies to the projected NOI at the time of sale, and it is used to estimate the terminal value of the asset at the end of your hold period. These are two separate assumptions, and the gap between them drives a significant portion of your projected return.
| Concept | Definition | Application |
|---|---|---|
| Going-in cap rate | Year-one NOI divided by purchase price | Sets the acquisition yield and initial valuation benchmark |
| Exit cap rate | Projected forward NOI at sale divided by estimated sale price | Estimates terminal value and sale proceeds at end of hold period |
| Typical relationship | Exit cap rate is often set 25 to 50 basis points higher than going-in | Reflects uncertainty and market risk over the hold period |
| Impact on returns | A higher exit cap rate assumption reduces projected sale price | Conservative underwriting protects against overestimating returns |
Going-in and exit cap rates serve as critical underwriting inputs that reflect acquisition versus disposition valuation assumptions. If you buy a Brampton warehouse at a 5.5% going-in cap rate and model an exit at 5.5% five years later, you are assuming market conditions remain identical. Most experienced investors apply a 25 to 50 basis point premium to the exit cap rate to account for market uncertainty and asset ageing.
The exit cap rate is applied to forward projected NOI, not trailing NOI. Using trailing NOI to estimate sale proceeds understates what the property will generate at the time of sale and misleads your return projections. If your industrial tenant’s lease rolls to market rent in year three and NOI jumps 20%, your exit valuation should reflect that higher income stream, not the income from year one.
Pro Tip: When building a five-year hold model for a GTA industrial property, set your exit cap rate at least 25 basis points above your going-in cap rate. This single adjustment often separates realistic return projections from optimistic ones that do not survive contact with actual market conditions.
What are the key limitations of cap rate as a standalone metric?
Cap rate is a powerful screening tool, but treating it as a complete investment analysis is one of the most common and costly mistakes in industrial real estate investing. The metric has structural limitations that every investor must understand before relying on it for final decisions.
The core limitation is scope. Cap rate does not account for leverage, taxes, appreciation, or capital expenditures. A property with a 6.0% cap rate and a leaking roof requiring $500,000 in capital expenditure within 18 months is not the same investment as a 6.0% cap rate property in pristine condition. The cap rate treats them identically.
Additional limitations to keep in mind:
- It is a single-year snapshot. Cap rate reflects one year of income relative to current value. It says nothing about lease expiry risk, rent escalation clauses, or what happens when a major tenant vacates.
- It ignores financing. Two investors buying the same asset at the same cap rate but with different debt structures will have entirely different cash-on-cash returns and equity yields. Cap rate is the same for both; their actual investment performance will diverge significantly.
- NOI quality varies. A 6.0% cap rate built on a lease expiring in 12 months is fundamentally different from a 6.0% cap rate supported by a 10-year lease with a creditworthy logistics company. The number looks identical; the risk profile does not.
- It does not capture appreciation. Industrial properties in the GTA have delivered substantial capital gains over the past decade. Cap rate captures none of that upside.
The most effective approach is to use cap rate for initial screening and relative comparison, then layer in cash-on-cash return, internal rate of return (IRR), and a physical property assessment before making a final decision. A free cap rate and cash-on-cash calculator can help you run both metrics side by side to get a more complete picture of an investment’s potential.
How are industrial cap rates trending in the GTA market in 2026?
GTA industrial cap rates have shifted materially over the past four years, and understanding that trajectory is essential for pricing acquisitions and setting realistic return expectations in 2026.
Industrial real estate cap rates moved from approximately 5.2% in early 2022 to around 6.2% in early 2024, driven by rising interest rates and a recalibration of investor risk tolerance. This 100 basis point expansion represents a significant repricing of industrial assets across the GTA. A property that traded at a 5.2% cap rate in 2022 at $24,000,000 would need to be priced closer to $19,400,000 at a 6.2% cap rate with the same NOI. That is a value reduction of roughly 19% on the same income-producing asset.
| GTA industrial submarket | Approximate cap rate range (2026) | Key driver |
|---|---|---|
| Mississauga / Airport corridor | 5.0% to 5.8% | High demand, limited supply, institutional buyers |
| Brampton / Highway 410 corridor | 5.2% to 6.0% | Strong logistics demand, newer product |
| Vaughan / Highway 400 corridor | 5.5% to 6.2% | Mixed product age, active development pipeline |
| Durham Region (Ajax, Whitby, Oshawa) | 6.0% to 6.8% | Secondary market premium, longer lease-up periods |
| Milton / Burlington / Hamilton | 5.8% to 6.5% | Growing logistics hub, land availability |
Cap rates are tightly linked to capital market conditions including Government of Canada bond yields and the Bank of Canada’s overnight rate. As interest rates stabilise or decline in 2026, cap rate compression is possible in prime GTA submarkets, which would push values higher. Investors who acquire at today’s expanded cap rates with well-structured leases stand to benefit from both income yield and capital appreciation if the rate environment shifts favourably.
For current GTA industrial market trends and how vacancy rates are influencing NOI assumptions across these submarkets, the picture is nuanced. Vacancy has risen from historic lows but remains well below long-term averages in most GTA nodes, which continues to support NOI stability for well-leased assets.
Key takeaways
Cap rate is a reliable valuation and screening tool for GTA industrial real estate, but its accuracy depends entirely on NOI quality, and its usefulness depends on pairing it with IRR, cash-on-cash return, and local market context.
| Point | Details |
|---|---|
| Cap rate definition | Net operating income divided by market value, expressed as a percentage, measuring unleveraged annual yield. |
| NOI accuracy is critical | Use stabilised market-rate NOI, not in-place income from below-market leases, to avoid distorted cap rates. |
| Risk and price relationship | Higher cap rates signal higher risk or lower prices; lower cap rates reflect competitive, stable assets. |
| Going-in vs exit cap rate | Set exit cap rates 25 to 50 basis points above going-in rates to account for market uncertainty over the hold period. |
| GTA market context in 2026 | Industrial cap rates expanded from 5.2% to 6.2% between 2022 and 2024, creating repricing opportunities for buyers. |
Why I think most investors misuse cap rate in GTA industrial deals
I have reviewed hundreds of industrial property analyses across Mississauga, Brampton, Vaughan, and the Durham Region, and the single most consistent error I see is treating cap rate as a conclusion rather than a starting point. Investors find a 5.8% cap rate on a Brampton warehouse, compare it to a 5.5% cap rate on a Mississauga property, and assume the Brampton asset is the better deal. That comparison ignores lease term, tenant credit quality, building age, clear height, and the trajectory of rents in each submarket.
The second error I see regularly is accepting the vendor’s NOI without scrutiny. Sellers have every incentive to present the highest defensible NOI figure. I have seen cases where property management fees were excluded from operating expenses, where vacancy allowances were omitted, and where one-time income was blended into the recurring revenue line. Each of these inflates NOI and compresses the cap rate, making the asset appear more attractive than it is. Always reconstruct NOI from first principles before you trust the cap rate on an offering memorandum.
What I have found actually works is using cap rate as a filter at the top of the funnel. If a GTA industrial asset does not meet a minimum cap rate threshold relative to its submarket, it does not warrant deeper analysis. Once it clears that threshold, I move to cash-on-cash return, IRR over the projected hold period, and a physical assessment of capital expenditure requirements. That sequence protects against both overpaying and underestimating the true cost of ownership.
The GTA industrial market in 2026 offers genuine opportunity for investors who understand that cap rate expansion since 2022 has reset values. Buying at today’s cap rates with a five to seven year hold horizon, in a market where interest rates may moderate, is a structurally sound position. But only if the NOI is real, the lease is solid, and the submarket fundamentals support rent growth. Cap rate tells you the entry price. Everything else tells you whether that price is worth paying.
For a deeper look at how cap rates apply specifically to GTA industrial assets, the GTA industrial cap rate guide on the Mlawrealestate blog covers submarket-specific benchmarks in detail.
— Michael
Work with a GTA industrial real estate specialist

Evaluating industrial properties across the GTA requires more than a cap rate calculation. It requires current transaction data, submarket expertise, and the ability to reconstruct NOI accurately from real lease and expense documentation. Mlawrealestate, operating through Lennard Commercial Realty, provides exactly that for investors and property owners across Toronto, Mississauga, Brampton, Vaughan, Milton, and the Durham Region.
Whether you are acquiring your first industrial asset or managing a multi-property portfolio, the team at Mlawrealestate brings transaction-level market intelligence to every valuation and negotiation. Review the Vaughan manufacturing facility case study and the Milton industrial transaction to see how this expertise translates into measurable outcomes for clients.
FAQ
What is the capitalization rate in real estate?
The capitalization rate is net operating income divided by a property’s current market value, expressed as a percentage. It estimates the unleveraged annual yield on an income-producing property before financing costs.
How do you calculate cap rate for an industrial property?
Divide the property’s annual NOI by its current market value and multiply by 100. For example, an NOI of $1,200,000 on a $24,000,000 property produces a 5.0% cap rate.
What is a good cap rate for GTA industrial real estate in 2026?
GTA industrial cap rates currently range from approximately 5.0% to 6.8% depending on submarket, with prime Mississauga assets trading at the tighter end and secondary markets like Durham Region at the wider end.
Why does cap rate not include mortgage costs?
Cap rate is designed to measure a property’s performance independent of financing, so two investors with different mortgage structures can compare the same asset on equal terms. Leverage effects are captured separately through cash-on-cash return and IRR analysis.
What is the difference between going-in and exit cap rate?
The going-in cap rate uses year-one NOI and the purchase price to set the acquisition yield. The exit cap rate applies projected forward NOI at the time of sale to estimate terminal value, and is typically set 25 to 50 basis points higher to reflect market uncertainty over the hold period.
Recommended

About Michael Law
Managing Partner and Industrial Real Estate Broker at Lennard Commercial Realty. Representing tenants and landlords across Toronto and the GTA for 15+ years. Michael specializes in GTA industrial real estate — connect with Toronto's leading industrial broker at mlawrealestate.com/industrial-broker-toronto.