
Commercial real estate Louisville: 2026 investor's guide
By Michael Law · Industrial Real Estate Broker, Lennard Commercial Realty
TL;DR:
- Louisville’s industrial market shows low vacancy and steady rent growth, making it the lowest-risk income property.
- Investors should carefully analyze location, condition, and lease data to avoid overestimating market-wide signals.
Commercial real estate in Louisville is defined as income-producing property across four asset classes: industrial, office, retail, and multifamily. The Louisville market stands out for its industrial vacancy of 3.7% as of Q4 2025, a figure that signals strong occupier demand and limited available supply. Cap rates across Louisville commercial properties range from 5.76% to 11.04%, giving investors a wide spectrum from stabilised, lower-yield assets to higher-risk, higher-return plays. For investors, property managers, and business owners, understanding where Louisville sits within that range is the first step toward a sound acquisition decision.
What is the current state of the commercial real estate market in Louisville?
Louisville’s commercial property market in 2025 and into 2026 is a market of two speeds. The industrial sector is tight and competitive. The office sector is under measurable stress.
Industrial sector: low vacancy, steady demand
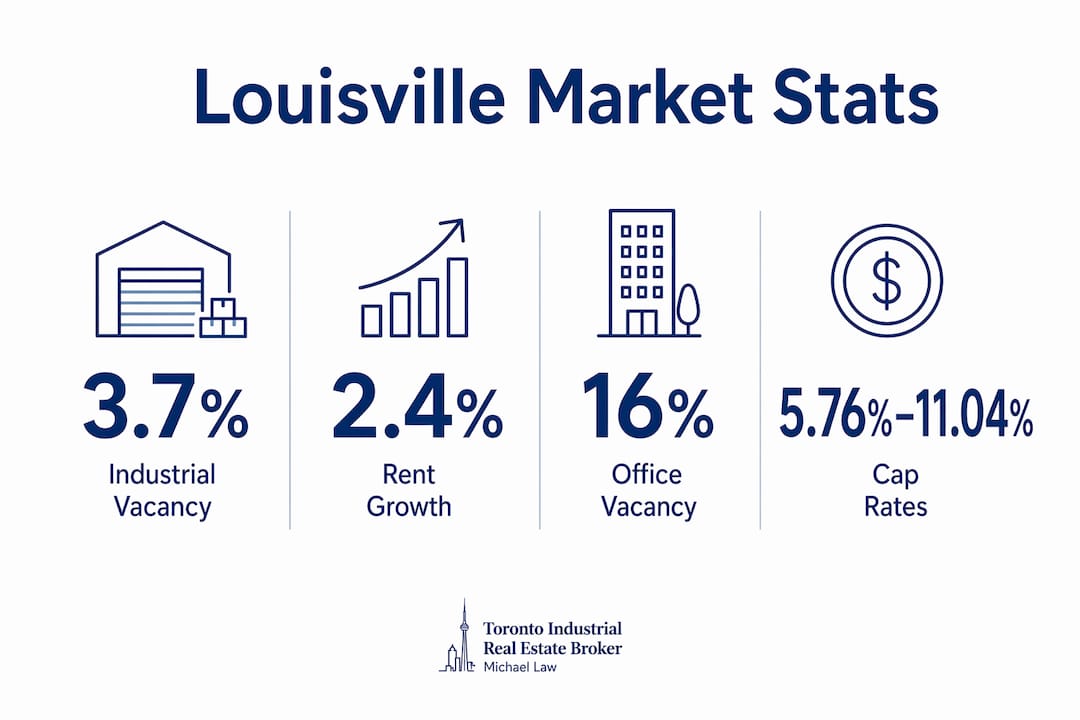
The industrial vacancy rate sits at 3.7% as of Q4 2025. That figure places Louisville among the stronger mid-market industrial cities in the United States. Demand is driven by logistics, last-mile distribution, and light manufacturing tenants who value Louisville’s central location and access to major interstate corridors. Low vacancy translates directly into pricing power for landlords and upward pressure on asking rents.
Rent growth in Louisville held at 2.3%–2.5% annually in 2025, outpacing the national average of 1.1%. That spread matters because it means Louisville landlords are growing income faster than most comparable markets, which supports asset valuations over a hold period.
Office sector: elevated vacancy and repositioning pressure
Downtown office vacancy reached 16% as of Q4 2025. That number reflects a structural shift, not a temporary dip. Remote and hybrid work patterns have reduced occupier demand for traditional Class A office floors, and sublease supply has added further pressure. Investors targeting office assets in Louisville need a clear repositioning thesis, whether that is conversion to residential, medical use, or creative office formats.
Pro Tip: Track net absorption, not just vacancy, when evaluating Louisville office assets. A building with 15% vacancy but positive absorption is a fundamentally different risk profile than one with 15% vacancy and growing sublease space.
Retail and multifamily: stable with selective upside
Retail in Louisville benefits from neighbourhood-level foot traffic in districts like the Highlands and NuLu. Well-located strip centres anchored by service tenants (grocery, pharmacy, personal services) have held occupancy well. Multifamily demand remains supported by population growth and affordability relative to coastal markets.
| Sector | Vacancy Rate | Rent Growth (2025) | Cap Rate Range |
|---|---|---|---|
| Industrial | 3.7% | 2.3%–2.5% | 5.76%–7.5% |
| Office (Downtown) | 16% | Flat to negative | 8%–11.04% |
| Retail (Neighbourhood) | Not publicly listed | Stable | 6%–9% |
| Multifamily | Not publicly listed | 2.3%–2.5% | 5.76%–8% |
Which property types are the best investment opportunities in Louisville?
The best investment properties in Louisville depend on your risk tolerance, financing structure, and target hold period. Each asset class carries a distinct income and appreciation profile.
Industrial: the lowest-risk income play
Industrial properties in Louisville offer the strongest combination of low vacancy and rent growth. A 3.7% vacancy rate means a well-located warehouse or distribution facility is unlikely to sit empty between tenants. Lease terms in industrial are typically longer (five to ten years), which reduces income volatility. For investors who prioritise predictable cash flow over short-term appreciation, industrial is the most defensible choice in the current Louisville market.

Tracking industrial property trends is particularly useful here because Louisville’s position as a logistics hub means demand drivers can shift with e-commerce volumes and supply chain restructuring.
Office: high yield, high risk
Office assets in Louisville carry cap rates toward the upper end of the 5.76%–11.04% range precisely because the market is pricing in occupancy risk. A 16% downtown vacancy rate is not catastrophic, but it requires an investor with the expertise and capital to manage extended lease-up periods or execute a conversion strategy. Office is not a passive investment in this environment.
Retail and multifamily: income stability with neighbourhood sensitivity
- Neighbourhood retail anchored by essential services produces reliable income. Avoid single-tenant retail dependent on discretionary spending.
- Multifamily in submarkets like Germantown and Portland benefits from combined rents across multiple units. Multi-unit properties in these neighbourhoods often achieve higher Debt Service Coverage Ratios (DSCR) than single-family rentals, making them more attractive to lenders.
- Mixed-use assets combining ground-floor retail with upper-floor residential are gaining traction in walkable districts.
- Student housing adjacent to the University of Louisville provides consistent demand, though management intensity is higher than standard multifamily.
The cap rate range of 5.76%–11.04% across Louisville commercial real estate listings means that property type and location selection directly determines your return. A stabilised industrial asset in a well-connected submarket will price closer to 5.76%. A vacant office building in a secondary location will price closer to 11%, reflecting the work required to stabilise it.
Pro Tip: When comparing property types, calculate your after-financing cash-on-cash return, not just the cap rate. A higher cap rate asset financed at 8.5% may produce less actual cash flow than a lower cap rate industrial property financed at 7.0%.
How do location and property condition affect investment success?
Neighbourhood-level due diligence is the single most important factor separating successful Louisville commercial investments from costly ones. Aggregate market data tells you the direction of the market. Granular property and location analysis tells you whether a specific asset will perform.
Neighbourhood profiles: Old Louisville vs. East End
Old Louisville contains a significant stock of older commercial and mixed-use buildings. These properties often carry attractive asking prices relative to newer construction. The risk is that older buildings in this district frequently present foundational, electrical, and mechanical issues that are not visible in a standard walkthrough. Investors who skip a thorough building inspection on older Louisville properties regularly encounter repair costs that eliminate projected returns in the first two years of ownership.
The East End, by contrast, features newer construction, higher household incomes, and stronger retail and office fundamentals. Entry prices are higher, but so is tenant quality and lease stability. The trade-off is a lower cap rate and less room for value-add upside.
Key location factors to assess before you buy
- Interstate access: Properties within two kilometres of I-64, I-65, or I-71 command premium rents from logistics tenants.
- Zoning flexibility: Louisville’s zoning code in certain districts allows mixed commercial and residential use, which expands your exit options.
- Parking ratios: Retail and office tenants in Louisville expect surface parking. A property with inadequate parking will face chronic leasing challenges regardless of rent pricing.
- Flood zone status: Parts of Louisville near the Ohio River and its tributaries carry flood risk. Confirm FEMA flood zone classification before signing a purchase agreement.
Value-add through rent optimisation
Listing units below market rent is a common practice in Louisville, often used to maintain low tenant turnover. Savvy investors target these properties deliberately. When a tenant vacates, the incoming lease is written at current market rent, producing an immediate and measurable increase in net operating income. This strategy works best in multifamily and smaller retail properties where individual unit rents are easy to reset at turnover.
Pro Tip: Request a rent roll with lease expiry dates before making an offer. Properties with multiple near-term lease expirations give you the fastest path to market rents, but they also carry short-term vacancy risk. Price accordingly.
What financial considerations apply when you buy commercial real estate in Louisville?
Understanding cap rates and financing structures is non-negotiable before you commit capital to Louisville commercial properties. The numbers below reflect current market conditions.
Cap rates and what they mean for your returns
Cap rates in Louisville range from 5.76% to 11.04% depending on asset class, location, and condition. A cap rate is calculated by dividing net operating income by purchase price. A property generating $100,000 in annual net operating income priced at a 7% cap rate sells for approximately $1,430,000. The same income stream priced at a 10% cap rate sells for $1,000,000. The difference reflects perceived risk, not income quality.
Market analysis confirms that cap rate selection is the primary lever investors control at acquisition. Buying at a compressed cap rate in a strong submarket limits upside but reduces downside risk. Buying at an elevated cap rate requires a clear plan to stabilise the asset.
DSCR loans: the preferred financing tool for Louisville investors
DSCR (Debt Service Coverage Ratio) loans are the dominant financing structure for income-producing commercial properties in Louisville. A DSCR loan qualifies the borrower based on the property’s income relative to its debt payments, not the borrower’s personal income. This makes it particularly useful for investors who hold multiple properties or operate through corporate entities.
Typical DSCR loan terms in Louisville include:
- Down payment of 20%–25% of the purchase price.
- Interest rates of 7.0%–8.5% depending on credit profile and property type.
- Minimum credit score of 660 for most lenders.
- DSCR ratio of 1.20 or higher, meaning the property generates 20% more income than its debt payments.
Louisville’s landlord-friendly regulatory environment reduces transactional friction and makes the market particularly attractive to DSCR-based investors focused on cash flow. Fewer regulatory barriers mean faster lease execution and lower compliance costs compared to more heavily regulated markets.
Example DSCR calculation
A four-unit multifamily property in Germantown generates $4,800 per month in combined rents, or $57,600 annually. After operating expenses of $18,000, net operating income is $39,600. Annual debt service on a $350,000 loan at 7.5% over 25 years is approximately $30,600. The DSCR is 39,600 divided by 30,600, which equals 1.29. That clears the 1.20 threshold most lenders require.
| Metric | Example Value |
|---|---|
| Gross annual rent | $57,600 |
| Operating expenses | $18,000 |
| Net operating income | $39,600 |
| Annual debt service | $30,600 |
| DSCR | 1.29 |
| Down payment (20%) | $87,500 |
Key takeaways
Louisville’s commercial property market rewards investors who combine sector selection with neighbourhood-level due diligence and sound DSCR-based financing.
| Point | Details |
|---|---|
| Industrial leads the market | A 3.7% vacancy rate and 2.3%–2.5% rent growth make industrial the strongest income play in Louisville. |
| Cap rates signal risk level | The 5.76%–11.04% range reflects asset quality and location; buy at the right rate for your risk tolerance. |
| Location determines performance | Neighbourhoods like Old Louisville and the East End carry fundamentally different risk and return profiles. |
| DSCR loans fit Louisville well | Landlord-friendly regulations and steady rents support DSCR qualification at the 1.20 threshold most lenders require. |
| Rent optimisation creates upside | Properties priced below market rent offer immediate income growth when leases turn over at current market rates. |
What I’ve learned from watching investors get Louisville wrong
Most investors who struggle in Louisville make the same mistake. They buy on aggregate market data and skip the property-level work. A 3.7% industrial vacancy rate is a market signal, not a guarantee that the specific building you are buying will lease quickly. I have seen investors acquire older industrial properties in secondary locations, assume the market tailwind would carry them, and then spend 18 months chasing tenants while carrying debt at 8%.
The investors who consistently perform well in Louisville do three things differently. First, they treat every acquisition as its own underwriting exercise, not a bet on the market. Second, they inspect older buildings with a structural engineer and a licensed electrician before removing conditions. The cost of that inspection is trivial relative to the cost of discovering a failing roof or outdated electrical panel after closing. Third, they read the rent roll carefully and price in the time and cost required to bring below-market leases to current rates.
Louisville’s landlord-friendly environment is a genuine advantage. Lease enforcement is straightforward, and the regulatory burden on landlords is lower than in many comparable cities. That advantage compounds over time if you buy right. It does not rescue a poorly underwritten acquisition.
The industrial segment, in particular, is worth serious attention from investors who typically focus on multifamily. The combination of long lease terms, low vacancy, and above-average rent growth produces a risk-adjusted return profile that multifamily in most Louisville submarkets cannot match right now. If you are building a commercial portfolio in this market, I would weight industrial heavily and treat office as a specialist play requiring a specific repositioning thesis.
— Michael
Commercial property listings and advisory from Mlawrealestate
Mlawrealestate brings institutional-grade market intelligence and transaction experience to investors and business owners seeking commercial real estate opportunities. Whether you are looking to acquire an industrial asset, evaluate a multifamily portfolio, or assess a retail property, the advisory process starts with data and ends with a defensible decision.

Browse commercial property listings across asset classes and geographies, or connect directly with the Mlawrealestate team for a consultation tailored to your investment criteria. Michael Law’s broader advisory work, including industrial leasing and investment sales across the GTA, is documented at Lennard Commercial Realty. For investors who want market reports before making a move, the industrial real estate insights library is a practical starting point.
FAQ
What is the industrial vacancy rate in Louisville?
Louisville’s industrial vacancy rate was 3.7% as of Q4 2025, reflecting strong occupier demand from logistics and distribution tenants.
What cap rates should I expect when buying commercial real estate in Louisville?
Cap rates in Louisville range from 5.76% to 11.04% depending on asset class, location, and property condition. Industrial assets in strong locations price toward the lower end of that range.
What is a DSCR loan and how does it apply to Louisville commercial properties?
A DSCR loan qualifies based on the property’s income relative to its debt payments rather than the borrower’s personal income. In Louisville, typical terms include a 20%–25% down payment, interest rates of 7.0%–8.5%, and a minimum credit score of 660.
Which Louisville neighbourhoods offer the best commercial investment opportunities?
The East End offers higher tenant quality and lease stability, while Old Louisville offers lower entry prices with higher due diligence requirements due to older building stock. Industrial submarkets near I-64, I-65, and I-71 offer the strongest logistics demand.
How fast is rent growing in Louisville commercial real estate?
Rent growth in Louisville held at 2.3%–2.5% annually in 2025, which outpaced the national average of 1.1% and supports income stability for commercial property investors.
Recommended

About Michael Law
Managing Partner and Industrial Real Estate Broker at Lennard Commercial Realty. Representing tenants and landlords across Toronto and the GTA for 15+ years. Michael specializes in GTA industrial real estate — connect with Toronto's leading industrial broker at mlawrealestate.com/industrial-broker-toronto.