
Toronto industrial submarket map: a complete 2026 guide
By Michael Law · Industrial Real Estate Broker, Lennard Commercial Realty
TL;DR:
- A Toronto industrial submarket map divides the GTA into geographic corridors based on zoning, highway access, and market dynamics. It helps investors and tenants evaluate location-specific factors such as vacancy rates, rents, and permitted uses to make informed decisions. Understanding physical attributes and zoning is essential to avoid costly mistakes in leasing or acquiring industrial properties.
A Toronto industrial submarket map categorises the Greater Toronto Area’s industrial real estate into distinct geographic corridors and zoning frameworks that investors, tenants, and business owners use to evaluate locations. The four primary corridors are GTA West, GTA East, GTA Central, and GTA North. Each corridor carries its own inventory profile, vacancy rate, rental range, and zoning designations such as E1, E2, E3, M1, M2, and M3. Understanding this submarket map is the foundation of any informed site selection or acquisition decision in one of North America’s most competitive industrial markets.
What is a Toronto industrial submarket map?
A Toronto industrial submarket map is the categorisation of the GTA’s industrial land into geographic zones based on highway access, zoning, inventory type, and market dynamics. The term “submarket map” is the common industry shorthand. The recognised industry term is “industrial submarket analysis,” which brokers and institutional investors use when underwriting properties or advising tenants on site selection.

The map exists because industrial real estate in Toronto is not uniform. A logistics operator in Brampton faces entirely different conditions than a manufacturer in Scarborough. Grouping properties into submarkets lets investors compare vacancy rates, asking rents, and absorption trends on an apples-to-apples basis. Without this framework, comparing a 200,000-square-foot distribution centre in Mississauga to a 15,000-square-foot flex unit in North York produces meaningless data.
The four corridors recognised by the industry are GTA West, GTA East, GTA Central, and GTA North. GTA West inventory exceeds 181 million sq ft in Mississauga alone, making it the single largest industrial concentration in Canada. That scale reflects decades of development driven by Pearson International Airport and the Highway 401/410/427 interchange.
What are the main industrial submarkets in Toronto and the Greater Toronto Area?
The GTA’s four corridors serve different user types, price points, and operational requirements. Each has a distinct market profile that shapes leasing decisions and investment underwriting.
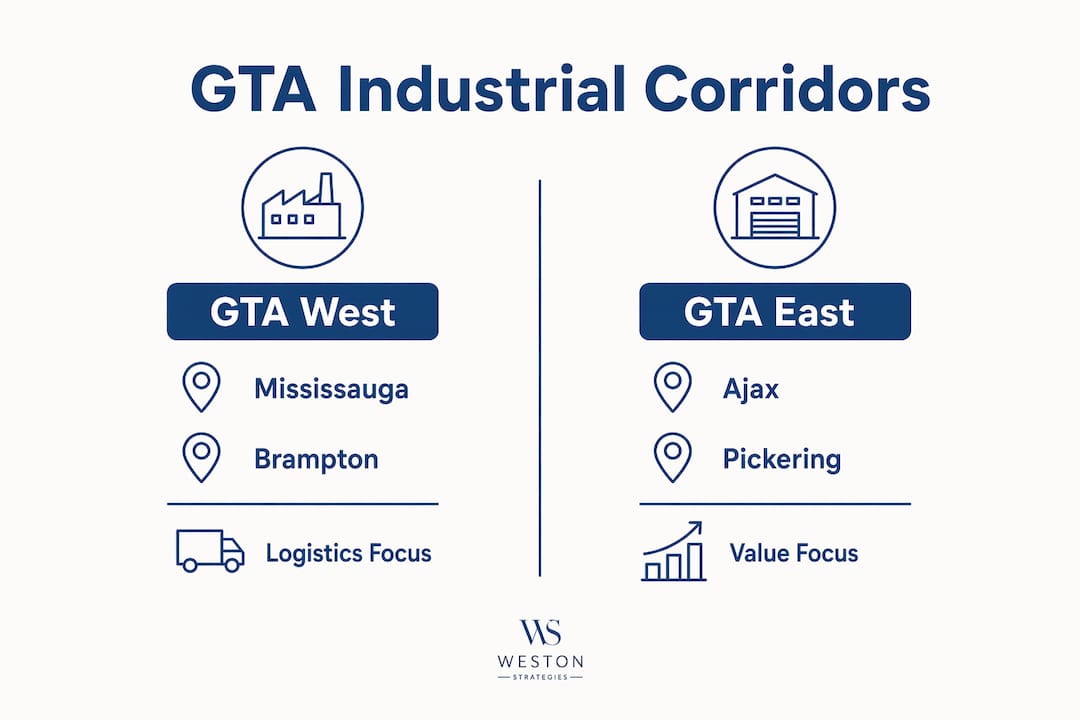
GTA West: the logistics powerhouse
GTA West covers Mississauga, Brampton, Milton, and Halton Hills. It is the region’s dominant logistics corridor. GTA West inventory exceeds 105 million sq ft in Brampton, with institutional-grade buildings featuring 32–36 foot clear heights and direct access to Highway 401, 410, and 427. Vacancy sits around 5–6%, and asking rents range from C$13 to C$18 per sq ft net, depending on building age and specification. This corridor attracts national retailers, third-party logistics providers, and e-commerce fulfilment operators.
GTA East: value-focused with growing supply
GTA East includes Ajax, Pickering, Whitby, and Oshawa. It offers lower rents than GTA West and attracts tenants priced out of Mississauga and Brampton. New supply has entered this corridor as developers follow Highway 401 east. The product mix includes both modern mid-bay buildings and older manufacturing facilities. Tenants here tend to be regional distributors, light manufacturers, and trades businesses seeking cost-effective space without sacrificing highway access.
GTA Central: tight land, premium rents
GTA Central covers Toronto, Vaughan, and Markham. Land is scarce, and new development is limited to infill and conversion projects. Clear heights in Toronto Central typically range 18–24 feet, compared to 32–36 feet in modern GTA West facilities. Despite older building stock, proximity to the urban consumer base drives demand. Last-mile logistics rents reach C$20 to C$25+ net in infill locations. Tenants accepting lower clear heights pay a premium for delivery speed and reduced transportation costs.
GTA North: emerging and affordable
GTA North spans Newmarket, Aurora, and the Barrie corridor. This submarket is emerging as tenants seek affordable alternatives to GTA West and Central. Demand is growing from light manufacturers, contractors, and businesses serving the Highway 400 corridor. Land costs remain lower than southern submarkets, and new supply is entering the market. Investors watching this corridor are positioning ahead of demand that has not yet fully priced in.
| Submarket | Key Municipalities | Typical Clear Height | Vacancy Profile | Rent Range (Net/sq ft) |
|---|---|---|---|---|
| GTA West | Mississauga, Brampton, Milton | 32–36 ft | ~5–6% | C$13–C$18 |
| GTA East | Ajax, Pickering, Whitby, Oshawa | 24–32 ft | Moderate | C$11–C$15 |
| GTA Central | Toronto, Vaughan, Markham | 18–24 ft | Tight | C$20–C$25+ |
| GTA North | Newmarket, Aurora, Barrie | 20–28 ft | Growing | C$10–C$14 |
Pro Tip: When comparing listings across corridors, always check clear height and truck court depth alongside the asking rent. A lower rent in GTA East with 28-foot clear heights may outperform a higher-rent GTA West option if your operation does not require 36-foot racking.
The GTA industrial market bifurcation between modern bulk logistics space in suburbs and older small-bay infill in Toronto is accelerating. Investors and tenants who treat all four corridors as interchangeable will consistently misjudge pricing and availability.
How do industrial zoning classifications affect the Toronto submarket map?
Zoning is the hidden variable that separates a well-priced acquisition from a costly mistake. Geography tells you where a property sits. Zoning tells you what you can legally do with it.
Toronto’s E-series zoning
Toronto uses E1, E2, and E3 designations under its Employment Industrial zoning framework. E1 is the most restrictive, permitting warehousing and logistics with limited outdoor storage. E1 zoning commands the lowest cap rates, around 4.0%, because it attracts the most institutional demand. E2 permits light manufacturing and some ancillary uses. E3 allows heavier industrial activity and ancillary retail, which inflates assessed value and property taxes. E3 properties trade at cap rates of 4.5–5.0%, reflecting higher operational risk and a narrower tenant pool.
Brampton and Mississauga’s M-series zoning
Brampton and Mississauga use M1, M2, and M3 designations. M1 covers light industrial uses including warehousing, distribution, and light assembly. M2 permits medium industrial activity. M3 allows heavy industrial uses including outdoor storage of materials and equipment. The M-series framework is broadly consistent with the E-series in intent, but the permitted uses and site coverage rules differ in detail. Tenants relocating from Toronto to Brampton must verify that their specific use is permitted under the applicable M designation, not just assume equivalency.
Zoning’s impact on value and operations
Cap rate spreads of 50–100 basis points among industrial properties often reflect zoning-driven risk differences rather than location alone. A logistics operator who acquires an E3 property expecting E1 economics will face higher taxes, a smaller resale market, and potential use restrictions. A site zoned E3 allowing ancillary retail inflates property value and taxes, making it inefficient for pure logistics use compared to E1 zoning.
Zoning also governs outdoor storage, floor area ratio, and parking requirements. Typical parking ratios are 1 space per 1,000 sq ft of gross floor area, and outdoor storage must be screened in most zones. A trucking company requiring a large yard for trailer storage must confirm M3 or equivalent zoning before signing a lease or making an offer.
| Zoning | Jurisdiction | Permitted Uses | Outdoor Storage | Typical Cap Rate |
|---|---|---|---|---|
| E1 | Toronto | Warehousing, logistics, light industrial | Limited, screened | ~4.0% |
| E2 | Toronto | Light manufacturing, ancillary office | Limited | ~4.2–4.4% |
| E3 | Toronto | Heavy industrial, ancillary retail | Permitted with conditions | ~4.5–5.0% |
| M1 | Brampton/Mississauga | Warehousing, distribution, light assembly | Limited | ~4.0–4.3% |
| M2 | Brampton/Mississauga | Medium industrial, manufacturing | Moderate | ~4.3–4.6% |
| M3 | Brampton/Mississauga | Heavy industrial, yard storage | Permitted | ~4.5–5.0% |
Pro Tip: Before signing any lease or submitting an offer, pull the zoning certificate from the municipality and confirm your specific use is listed as permitted, not just “similar to” a permitted use. Zoning officers interpret use descriptions narrowly.
The GTA industrial zoning guide for investors and tenants published by Michael Law | Lennard Commercial covers each designation in detail, including permitted uses, site coverage limits, and common compliance pitfalls.
Why does understanding the Toronto submarket map matter for investors and tenants?
Location within the submarket map directly determines rental rate, operational feasibility, and resale value. Choosing the wrong corridor or zoning category costs money in ways that are not always visible at the time of signing.
The practical consequences of a poor submarket decision include:
- Rent mismatch: A tenant budgeting for GTA East rates who signs in GTA Central will face 30–50% higher occupancy costs for the same square footage.
- Operational failure: A manufacturer requiring 36-foot clear heights who leases in Toronto Central will find that most available buildings top out at 24 feet.
- Zoning non-compliance: A logistics operator requiring outdoor trailer storage who leases an E1 property will face bylaw enforcement and potential lease termination.
- Investment underperformance: An investor who pays GTA West cap rates for a GTA North property is pricing in demand that has not yet materialised.
- Resale difficulty: A property zoned E3 in a predominantly E1 corridor attracts fewer institutional buyers, compressing exit multiples.
Transportation access is the primary driver of submarket value for logistics users. GTA West’s proximity to Pearson International Airport and the Highway 401/410/427 interchange is irreplaceable for national distribution. GTA East’s Highway 401 access serves regional distribution at lower cost. GTA Central’s value is entirely about proximity to the urban consumer, not highway throughput.
Workforce availability also varies by submarket. GTA West and East have established industrial labour pools. GTA North is growing its workforce base but remains thinner than southern corridors. A manufacturer requiring specialised trades should weight workforce density alongside rent when evaluating submarkets.
For investors, understanding which submarkets attract the most demand in 2026 is the starting point for underwriting. Vacancy, absorption, and new supply data mean different things in each corridor. A 5% vacancy rate in GTA Central signals extreme tightness. The same rate in GTA North signals a healthy but not overheated market.
Pro Tip: Match your submarket selection to your primary operational constraint. If clear height drives your racking design, start with GTA West. If last-mile delivery speed drives your cost model, start with GTA Central. If cost per square foot is the binding constraint, start with GTA East or GTA North.
How are Toronto industrial submarket boundaries defined?
Toronto industrial submarket boundaries are not officially mapped by any government body. They are defined by broker consensus based on highway corridors and proximity to core infrastructure nodes. This matters because the same property can be tagged differently by different brokers, creating confusion for tenants and investors who rely on listing data.
The factors that define submarket boundaries in practice include:
- Highway corridors (Highway 401, 410, 427, 400, 407)
- Proximity to Pearson International Airport or Port of Hamilton
- Municipal boundaries (Mississauga vs. Brampton vs. Toronto)
- Zoning cluster patterns (concentrations of M1 or E1 properties)
- Transit and intermodal terminal access
Listings tagged “Toronto Central” often indicate older, multi-tenant product with smaller bays and limited truck court depth, versus “GTA West” listings which typically describe institutional-grade logistics space near airports and intermodal terminals. A tenant searching for bulk distribution space who filters by “Toronto” without understanding this distinction will waste time reviewing properties that cannot meet their operational requirements.
Submarket naming conventions vary among brokers, and an internal understanding of corridor nuances is critical for accurate market analysis. A property on the border of Mississauga and Brampton may appear in either submarket depending on the brokerage’s internal mapping convention. The physical characteristics of the property, its zoning, and its highway access matter more than the submarket label attached to the listing.
Pro Tip: When reviewing listings, ignore the submarket label and focus on the property’s actual highway access, clear height, zoning designation, and truck court configuration. These physical attributes define the property’s functional submarket better than any label.
Working with a broker who has direct experience in the specific corridor you are targeting eliminates the ambiguity created by inconsistent submarket labelling. Michael Law | Lennard Commercial tracks corridor-level data across all four GTA zones and can identify properties that match your operational profile regardless of how they are labelled in listing databases.
Key takeaways
The Toronto industrial submarket map is the essential framework for matching operational requirements to the right GTA corridor and zoning designation before committing to a lease or acquisition.
| Point | Details |
|---|---|
| Four primary corridors | GTA West, East, Central, and North each serve distinct user types, price points, and operational profiles. |
| Zoning drives value | E1 and M1 command the lowest cap rates (~4.0%); E3 and M3 trade at 4.5–5.0% due to broader use permissions and higher risk. |
| Boundaries are informal | Submarket lines are set by broker consensus, not government mapping; physical attributes matter more than listing labels. |
| Rent varies sharply by corridor | Last-mile infill in GTA Central reaches C$25+ net; GTA North starts around C$10 net, reflecting demand maturity. |
| Zoning compliance is non-negotiable | Confirm permitted use, outdoor storage rules, and parking ratios before signing any lease or submitting an offer. |
What I’ve learned from a decade of GTA industrial transactions
The most expensive mistakes I see investors and tenants make are not about overpaying on rent. They are about misreading the relationship between geography and zoning.
A client once shortlisted a property in Toronto’s east end because the rent looked competitive relative to GTA West. The building was zoned E2, the client needed outdoor trailer storage, and the deal collapsed at the zoning review stage. Three months of search time and legal fees were lost because the submarket label said “Toronto East” and nobody checked the zoning certificate before the letter of intent was signed.
The GTA industrial market is bifurcating faster than most market reports capture. Institutional-grade bulk logistics space in GTA West is becoming a different asset class from small-bay infill in Toronto Central. The tenants, the investors, the cap rates, and the lease structures are diverging. Treating them as comparable because they both appear on a “GTA industrial” search is a category error.
My advice to any investor or tenant entering this market is to build your submarket analysis from the inside out. Start with your operational requirements: clear height, truck court depth, outdoor storage needs, and workforce access. Map those requirements to the zoning designations that permit them. Then identify which corridors contain those zoning clusters. The submarket label comes last, not first.
The Toronto industrial submarket map is a tool, not a destination. It organises a complex market into navigable categories. But the categories only hold value when you understand what drives them. Geography matters. Zoning matters more. And the intersection of the two is where the real decisions get made.
For investors looking to find value in Toronto industrial properties, the submarket map is the starting point, not the conclusion. The conclusion is a specific property, in a specific zone, with a specific tenant profile that matches the corridor’s demand drivers.
— Michael Law
Industrial submarket expertise for Toronto and the GTA
Navigating the GTA’s industrial corridors requires more than a map. Michael Law | Lennard Commercial provides corridor-level submarket analysis, zoning verification, and site selection support for tenants, investors, and business owners across Mississauga, Brampton, Vaughan, Markham, Ajax, Whitby, Milton, and Barrie. Whether you are evaluating a lease in GTA West or assessing an acquisition in GTA North, the right submarket data changes the outcome. Explore GTA industrial locations and industrial tenant representation services to start your search with corridor-specific intelligence.
FAQ
What is a Toronto industrial submarket map?
A Toronto industrial submarket map categorises the GTA’s industrial real estate into geographic corridors, including GTA West, East, Central, and North, each defined by zoning, inventory type, and market conditions. It is the standard framework brokers and investors use for site selection and market analysis.
What is the largest industrial submarket in the GTA?
GTA West is the largest industrial submarket, with Mississauga alone holding over 181 million sq ft of inventory. Its proximity to Pearson International Airport and major highway interchanges makes it the region’s primary logistics corridor.
How does zoning affect industrial submarket selection?
Zoning designations such as E1, M1, E3, and M3 determine permitted uses, outdoor storage rights, and parking requirements. E1 and M1 suit warehousing and logistics; E3 and M3 permit heavier uses but carry higher cap rates and tax burdens.
Are Toronto industrial submarket boundaries official?
Toronto industrial submarket boundaries are not officially defined by any government body. They are established by broker consensus based on highway corridors, municipal boundaries, and infrastructure proximity, and can vary between brokerages.
What rents should I expect in GTA Central versus GTA West?
GTA Central last-mile infill properties command C$20 to C$25+ net per sq ft due to urban proximity and scarce land. GTA West institutional logistics space ranges from C$13 to C$18 net per sq ft, reflecting higher supply and modern building stock.
Recommended

About Michael Law
Managing Partner and Industrial Real Estate Broker at Lennard Commercial Realty. Representing tenants and landlords across Toronto and the GTA for 15+ years. Michael specializes in GTA industrial real estate — connect with Toronto's leading industrial broker at mlawrealestate.com/industrial-broker-toronto.
Related Articles

More Toronto Industrial Real Estate Insights
Common Questions
What is a sale-leaseback in industrial real estate?
A sale-leaseback is a transaction in which an industrial property owner sells their building to an investor and simultaneously signs a long-term lease to remain in the property as a tenant. The seller unlocks the capital tied up in their real estate while retaining full operational use of the facility. The buyer acquires a tenanted investment property with immediate cash flow from a known occupant.
Read →What is a dock-to-grade ratio in industrial real estate?
Dock-to-grade ratio in industrial real estate refers to the number of dock-level loading doors relative to the building's floor area, typically expressed as one dock door per X,000 square feet. It is a key specification for distribution and warehousing tenants because it determines how many trucks can load and unload simultaneously and therefore the building's throughput capacity.
Read →What is clear height in a warehouse or distribution centre?
Clear height in a warehouse or distribution centre refers to the usable vertical space from the finished floor to the lowest overhead obstruction — typically the bottom of the roof structure, sprinkler heads, or HVAC equipment. It is the single most important building specification for warehouse tenants because it determines how many racking levels can be installed and therefore how much product can be stored per square foot of floor space.
Read →