
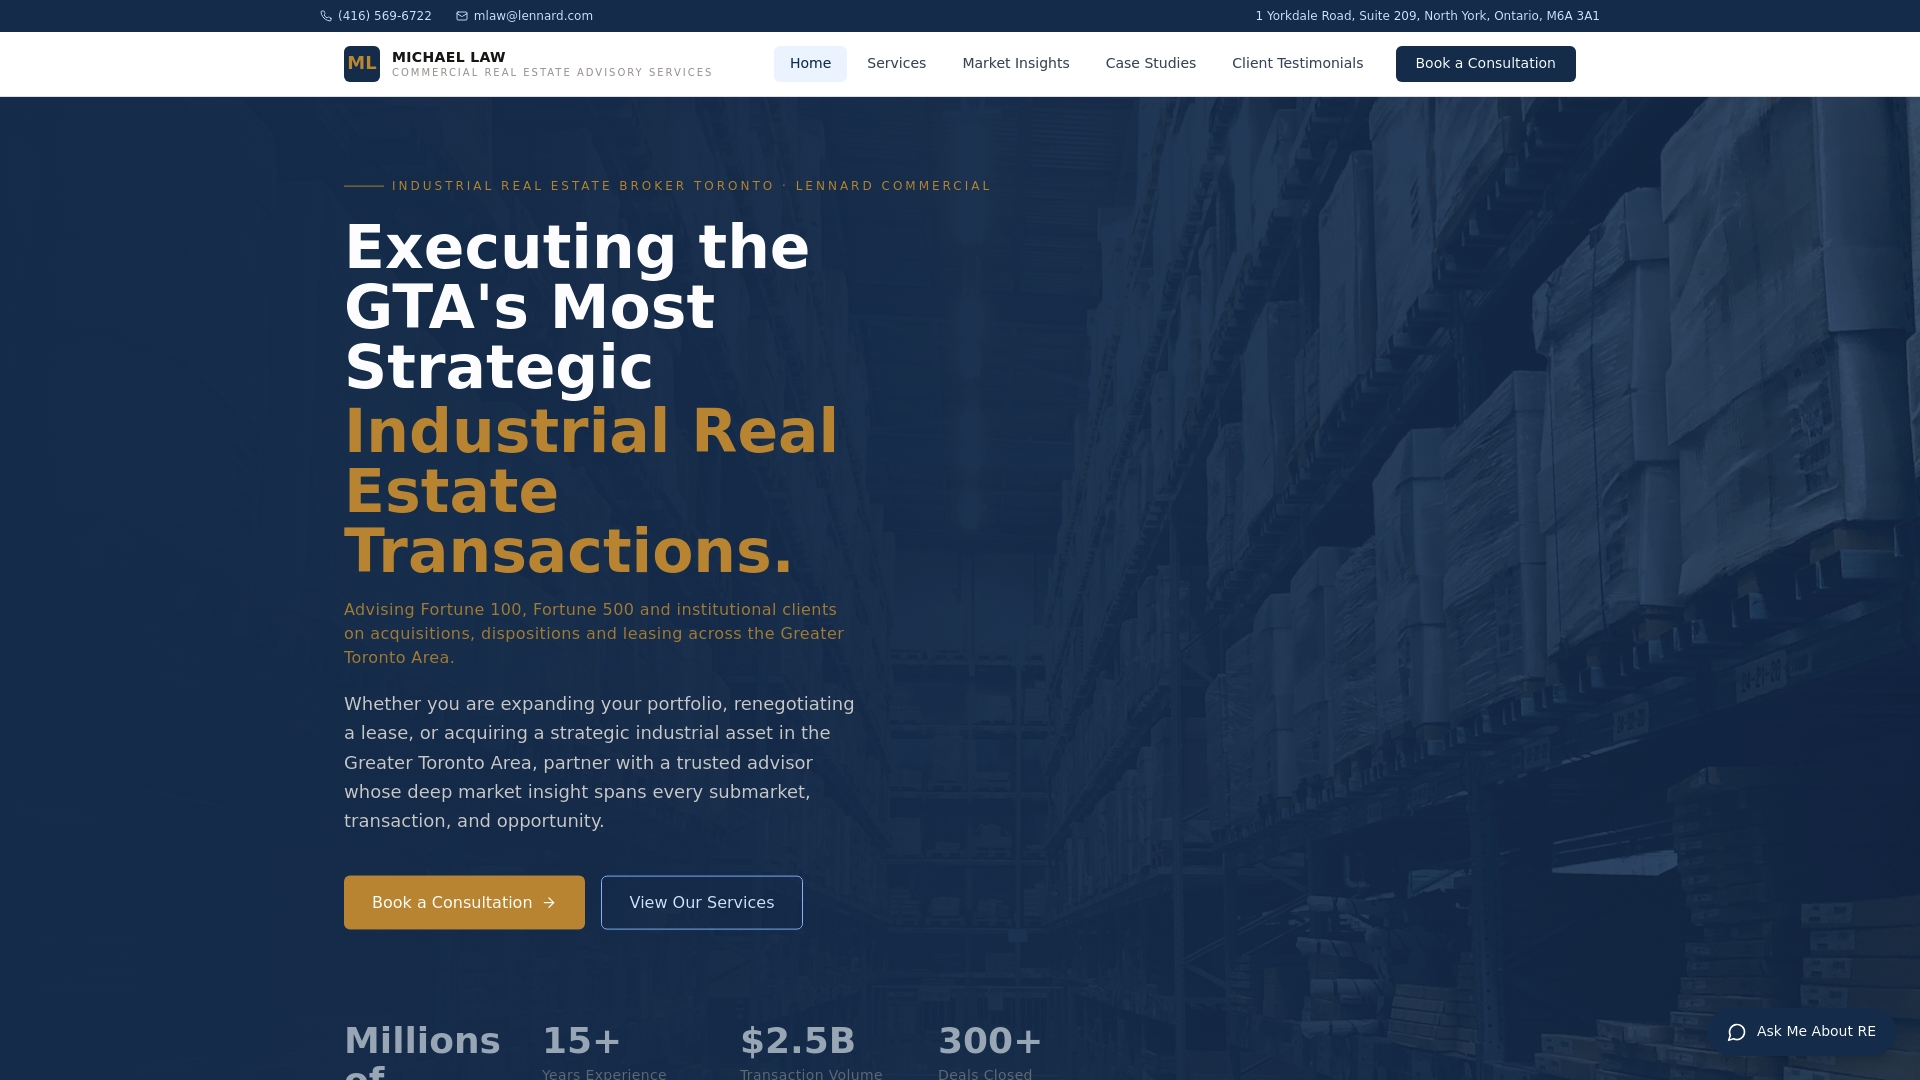
GTA industrial real estate research: 2026 guide
By Michael Law · Industrial Real Estate Broker, Lennard Commercial Realty
GTA industrial real estate research: 2026 guide
TL;DR:
- Effective GTA industrial real estate research depends on layered, submarket-level data analysis, continuous monitoring, and stress-testing assumptions. Relying solely on national averages or outdated information can lead to costly misjudgments, especially given the market’s rapid shifts. Successful strategies incorporate local insights, metrics tracked over time, and disciplined validation before making investment or leasing decisions.
Real estate research is the process of collecting, analysing, and interpreting detailed market and property data to guide industrial real estate decisions in the Greater Toronto Area. For investors, occupiers, and landlords operating in GTA submarkets like Mississauga, Brampton, Vaughan, and Durham Region, this means going well beyond national headlines. The GTA industrial sector is one of the most competitive asset classes in Canada, and the gap between a well-researched decision and a poorly informed one is measured in millions of dollars. Platforms like ATTOM and CoStar, combined with submarket-level vacancy and absorption data, form the analytical backbone of every credible property market analysis in 2026.
What data sources are essential for real estate research in the GTA?
The quality of your research is only as strong as the sources feeding it. For GTA industrial real estate, three tiers of data matter: national platforms, local commercial databases, and proprietary submarket intelligence.
National and institutional platforms provide the broadest coverage. ATTOM delivers parcel-level data including ownership history, tax-delinquency status, and transaction records. CoStar covers commercial listings, lease comparables, and building-level analytics across the GTA. These platforms are the starting point, not the finish line.
Local and municipal data sources fill the gaps that national tools miss. Toronto’s open data portal, Peel Region planning documents, and York Region employment land studies all contain zoning histories, building permit activity, and infrastructure investment plans. These records reveal where industrial demand is heading before it shows up in asking rents.
Proprietary brokerage intelligence is the third tier and often the most valuable. Firms like Mlawrealestate, operating in affiliation with Lennard Commercial Realty, track off-market transactions, lease renewal activity, and tenant movement across every major GTA corridor. That intelligence does not appear in any public database.
Key data categories to gather for any GTA industrial research project:
- Vacancy rates by submarket (Toronto West, North GTA, East GTA/Durham)
- Net asking rent per square foot, segmented by building class and bay size
- Absorption rates (net and gross) over trailing 12-month periods
- Land values and serviced industrial land availability
- Employment growth by sector in target municipalities
- Zoning classifications and permitted uses for target properties
- Lease expiry schedules for comparable buildings in the submarket
Pro Tip: Cross-reference CoStar lease comps against municipal building permit data. When new permits spike in a submarket, asking rents typically follow within 12–18 months. Spotting that lead indicator early gives you a negotiating advantage before the broader market catches on.
As local conditions diverge significantly from national trends, relying on a single data source produces a distorted picture. GTA industrial research demands layered verification across at least two independent data streams.
Which metrics best reveal GTA industrial real estate trends?
Metrics are the language of property market analysis. Knowing which ones to track, and how to read them together, separates informed decisions from expensive guesses.

The table below defines the core indicators used in GTA industrial real estate research and explains what each one signals in practice.
| Metric | Definition | What It Signals in the GTA |
|---|---|---|
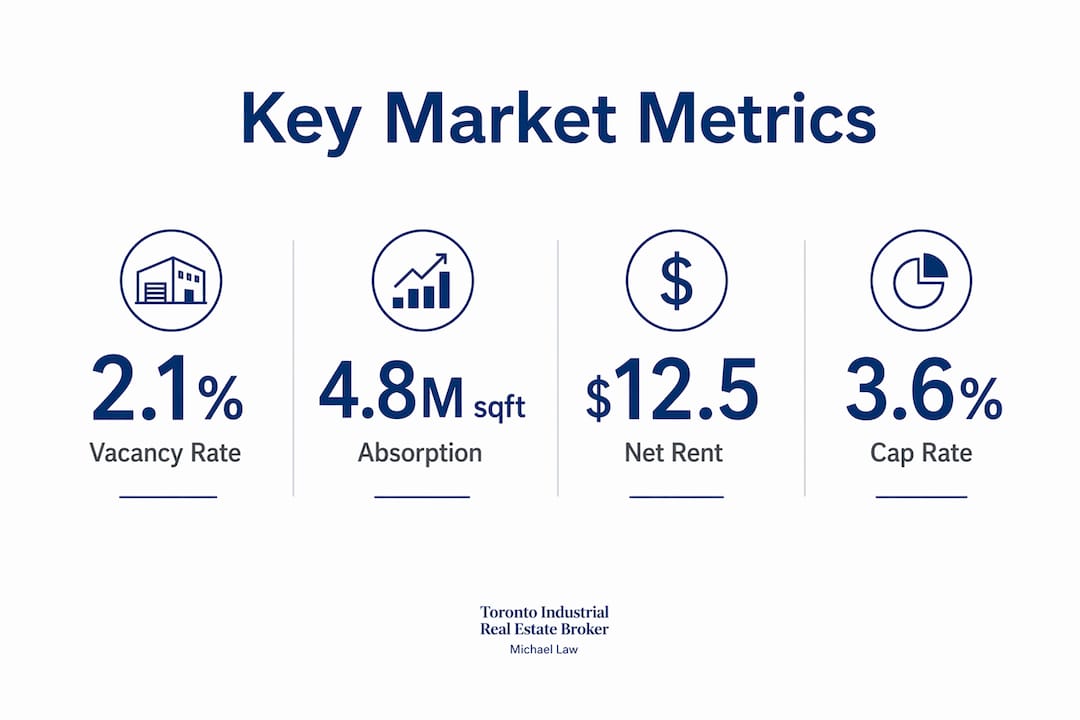
| Vacancy Rate | Percentage of total inventory available for lease | Below 2% in core GTA nodes signals extreme supply constraint and landlord leverage |
| Net Absorption | Change in occupied space over a period | Positive absorption confirms active tenant demand; negative signals contraction |
| Average Net Rent ($/sq ft) | Asking or achieved rent per square foot | Tracks pricing pressure; compare by bay size and clear height, not just geography |
| Price Per Square Foot (Sale) | Sale price divided by total building area | Benchmarks investment value; compare against replacement cost to assess upside |
| Months of Supply | Inventory divided by monthly absorption rate | Under 3 months favours landlords; over 6 months shifts leverage to tenants |
| Employment Growth Rate | Job creation in industrial-adjacent sectors | Logistics, e-commerce, and manufacturing hiring predicts future space demand |
| Cap Rate | Net operating income divided by purchase price | Reflects investor risk appetite; compression signals strong demand for the asset class |
Accurate market health evaluation requires integrating geography, price tiers, and supply-side metrics rather than relying on national average prices alone. That principle applies directly to GTA industrial submarkets, where Brampton warehouse rents and Oshawa flex-industrial rents can diverge by 30% or more despite sitting within the same regional market.
Employment data deserves particular attention. Sustained recovery in any real estate sector depends on labour market confidence and real income growth, not just financing conditions. For industrial real estate, this translates directly: when logistics and manufacturing employers are hiring in Vaughan or Ajax, demand for warehouse and distribution space follows within one to two quarters.
Tracking these metrics over time, rather than as point-in-time snapshots, reveals the direction of the market. A vacancy rate of 3.5% falling from 6% tells a very different story than a vacancy rate of 3.5% rising from 1.8%.
How do you apply property market analysis to GTA investment and leasing decisions?
Research without application is just data collection. The real value of investment property analysis emerges when findings drive specific decisions on pricing, timing, and structure.
Here is a practical framework for translating GTA industrial research into decisions:
-
Establish your submarket baseline. Before evaluating any specific property, map the submarket’s vacancy rate, average net rent, and recent absorption trend. This baseline tells you whether you are negotiating in a landlord’s market or a tenant’s market. In Mississauga’s Airport Corridor, for example, vacancy has historically sat below 1.5%, which means tenants must move fast and expect limited concessions.
-
Run a stress-tested pro forma. Pro forma underwriting benefits from stress-testing assumptions across multiple economic scenarios. Model at least three rent growth scenarios (base, conservative, and downside) and test the deal’s returns under each. A Brampton distribution centre that pencils out at $18.50/sq ft net rent should also be modelled at $16.00 to confirm the investment thesis holds under pressure.
-
Identify pricing anomalies. Granular, parcel-level data including ownership history and tax-delinquency status helps identify off-market opportunities. A property with a long-tenured owner, no recent refinancing, and a tax assessment well below market value is a candidate for a below-market acquisition. These signals do not appear in listing databases.
-
Compare submarket data against national benchmarks selectively. National datasets can obscure local realities; industrial research needs proprietary submarket comparisons and employment and vacancy tracking. A national cap rate average of 5.2% means little when Vaughan industrial assets are trading at 4.1% due to land scarcity and transit infrastructure investment.
-
Use lease comp analysis for negotiation leverage. Pull the last 12 months of comparable lease transactions in the target building’s submarket. Identify the delta between asking rents and achieved rents. That spread is your negotiating room. In a softening submarket, landlords often hold asking rents firm while offering free rent periods or tenant improvement allowances instead.
-
Adjust portfolio strategy based on absorption trends. If net absorption in the East GTA corridor is turning negative while North GTA remains positive, a portfolio rebalancing decision becomes data-driven rather than intuitive.
Pro Tip: When reviewing lease comparables, always ask for the total occupancy cost, not just the net rent. Additional rent (operating costs, property taxes, insurance) in GTA industrial buildings can add $4.00–$8.00/sq ft annually. Two deals with identical net rents can have very different total costs depending on the building’s age and tax assessment.
The data-driven approach to GTA decisions consistently outperforms intuition-based strategies, particularly in a market as supply-constrained and competitively priced as the GTA industrial sector.
What pitfalls should GTA stakeholders avoid in real estate research?
The most common research failures in GTA industrial real estate are not about missing data. They are about misusing the data that is available.
Relying on aggregated national data is the most frequent error. Effective research requires disaggregating by geography and supply-demand metrics rather than accepting broad averages. A national industrial vacancy rate of 4.8% tells a GTA investor nothing useful when core Toronto industrial vacancy sits below 2% and select Hamilton submarkets sit above 7%.
Common pitfalls to avoid in GTA industrial real estate research:
- Using stale data. Industrial market conditions in the GTA shift quarterly. A vacancy report from 18 months ago is not a baseline. It is a liability. Always confirm the data vintage before drawing conclusions.
- Ignoring local employment shifts. A major employer relocating out of a submarket, or a new distribution hub opening nearby, reshapes demand within months. Employment tracking is not optional in industrial research.
- Treating asking rents as achieved rents. In any market cycle, there is a gap between what landlords list and what tenants actually pay. Research that conflates the two will produce a distorted view of true market pricing.
- Overlooking inflation’s effect on occupancy costs. Households paying $165 more per month for non-housing essentials face real purchasing power constraints. For industrial tenants, the equivalent pressure comes from rising operating costs, fuel surcharges, and labour expenses that compress the rent they can afford to pay.
- Applying residential market logic to industrial assets. Price per square foot trends in the residential sector, median listing price movements, and mortgage rate sensitivity do not translate directly to industrial leasing or investment decisions. The asset classes behave differently.
- Skipping submarket-level analysis. The GTA contains dozens of distinct industrial nodes. Lumping Pickering, Ajax, and Whitby into a single “Durham Region” analysis misses meaningful differences in land availability, zoning flexibility, and tenant demand profiles.
The solution to most of these pitfalls is continuous monitoring rather than periodic research. The GTA industrial market moves too quickly for annual or semi-annual data reviews to be sufficient. GTA real estate strategies for investors that perform consistently are built on real-time intelligence, not retrospective reports.
Key takeaways
Effective GTA industrial real estate research requires submarket-level data, stress-tested financial modelling, and continuous market monitoring rather than reliance on national averages or point-in-time snapshots.
| Point | Details |
|---|---|
| Submarket data is non-negotiable | GTA industrial nodes like Mississauga, Vaughan, and Durham diverge sharply from national averages. |
| Layer your data sources | Combine ATTOM parcel data, CoStar lease comps, and proprietary brokerage intelligence for accuracy. |
| Track metrics over time | A vacancy rate’s direction matters as much as its current level for investment and leasing decisions. |
| Stress-test every pro forma | Model base, conservative, and downside rent scenarios before committing to any acquisition or lease. |
| Monitor employment trends | Hiring activity in logistics and manufacturing predicts industrial space demand one to two quarters ahead. |
What i have learned about research discipline in the GTA industrial market
The GTA industrial market in 2026 rewards preparation and punishes assumptions. I have seen experienced investors overpay for Brampton assets because they anchored to 2022 cap rates without accounting for the absorption slowdown that followed. I have also seen tenants lock in favourable lease terms in Markham because they tracked a specific landlord’s vacancy exposure for six months before approaching them.
The technology available today, from ATTOM’s AI-powered parcel analysis to CoStar’s market dashboards, is genuinely useful. But technology surfaces data. It does not interpret context. Knowing that a Vaughan industrial building has been vacant for 14 months is a data point. Understanding why it has been vacant, whether it is a ceiling height issue, a zoning constraint, a pricing problem, or a landlord relationship issue, requires local knowledge that no platform provides.
My honest view is that most research failures in this market come from moving too fast. Investors see a listing, run a quick analysis, and submit an offer before they have verified the submarket absorption trend or confirmed the building’s true operating cost structure. Slowing down the research phase almost always improves the outcome of the transaction phase.
The best research discipline I have seen combines three things: a consistent set of metrics tracked over time, a network of local contacts who surface off-market intelligence, and a willingness to walk away from deals that do not survive stress-testing. That combination is harder to build than any data subscription. It is also far more valuable. You can read more about how I approach this at Lennard Commercial Realty, where my full transaction background and market focus are outlined.
— Michael
Explore GTA industrial listings and expert advisory services
Mlawrealestate provides institutional-grade market intelligence and direct access to GTA industrial properties across every major corridor, from Toronto’s inner suburbs to Hamilton and Durham Region. Whether you are a logistics operator seeking warehouse space in Mississauga, a private investor evaluating a Brampton acquisition, or a landlord repositioning an asset in Vaughan, the research and advisory support you need is available in one place.
Browse current GTA industrial property listings to see available opportunities across the GTA’s most active industrial nodes. Every listing is supported by submarket context, comparable lease data, and direct access to advisory expertise. Mlawrealestate combines the reach of Lennard Commercial Realty with deep specialisation in the industrial asset class, giving clients a genuine edge in one of Canada’s most competitive property markets.
FAQ
What is industrial real estate research?
Industrial real estate research is the systematic collection and analysis of market data, including vacancy rates, absorption, rents, and employment trends, to inform leasing, investment, and development decisions in specific submarkets.
Which GTA submarkets are most active for industrial real estate?
Toronto West (Mississauga Airport Corridor), North GTA (Vaughan and Brampton), and East GTA (Durham Region including Ajax, Whitby, and Oshawa) are the GTA’s most active industrial corridors in 2026.
How do vacancy rates affect GTA industrial lease negotiations?
Vacancy rates below 2% give landlords strong pricing leverage, while rates above 5% shift negotiating power toward tenants. Always compare the current rate against its 12-month trend, not just the point-in-time figure.
Why is national data insufficient for GTA industrial research?
National datasets obscure local realities because industrial conditions vary sharply by submarket. A national vacancy average can mask a 1.5% vacancy in Mississauga and a 7% vacancy in Hamilton within the same reporting period.
How often should GTA industrial market data be reviewed?
Quarterly reviews are the minimum standard for active investors and occupiers. The GTA industrial market moves fast enough that annual data reviews produce decisions based on conditions that no longer exist.
Recommended

About Michael Law
Managing Partner and Industrial Real Estate Broker at Lennard Commercial Realty. Representing tenants and landlords across Toronto and the GTA for 15+ years. Michael specializes in GTA industrial real estate — connect with Toronto's leading industrial broker at mlawrealestate.com/industrial-broker-toronto.
Related Articles


More Toronto Industrial Real Estate Insights
Articles & Analysis
Warehouse Demand Trends GTA in 2026
Read →Toronto Warehouse Leasing Guide for Tenants
Read →Gross Lease vs Net Lease Explained
Read →Tenant representation services: GTA industrial guide 2026
Discover how tenant representation services can save you 10%-25% on industrial leases in the GTA. Secure the best deals today!
Read →How to qualify industrial tenants: a GTA landlord's guide
Learn how to qualify industrial tenants effectively. Discover key strategies for GTA landlords to avoid costly disputes and ensure tenant success.
Read →Common Questions
What is a sale-leaseback in industrial real estate?
A sale-leaseback is a transaction in which an industrial property owner sells their building to an investor and simultaneously signs a long-term lease to remain in the property as a tenant. The seller unlocks the capital tied up in their real estate while retaining full operational use of the facility. The buyer acquires a tenanted investment property with immediate cash flow from a known occupant.
Read →What is a dock-to-grade ratio in industrial real estate?
Dock-to-grade ratio in industrial real estate refers to the number of dock-level loading doors relative to the building's floor area, typically expressed as one dock door per X,000 square feet. It is a key specification for distribution and warehousing tenants because it determines how many trucks can load and unload simultaneously and therefore the building's throughput capacity.
Read →What is clear height in a warehouse or distribution centre?
Clear height in a warehouse or distribution centre refers to the usable vertical space from the finished floor to the lowest overhead obstruction — typically the bottom of the roof structure, sprinkler heads, or HVAC equipment. It is the single most important building specification for warehouse tenants because it determines how many racking levels can be installed and therefore how much product can be stored per square foot of floor space.
Read →